


It wasn’t long before the team at SocialCops wanted to explore the possibilities with free to use satellite data. As we got deep into this we realized the lack of knowledge available online. After a lot of struggle, we managed to crack Landsat to an extent. Almost everything the team builds at SocialCops scale and automation are critical – hence we built this R library, rLandsat, to automate the process to acquire Landsat8 imagery. Recently, it was accepted by CRAN (yayy!). Here is the link: rLandsat – CRAN

This article was first published on SocialCops’ Blog here
About rLandsat
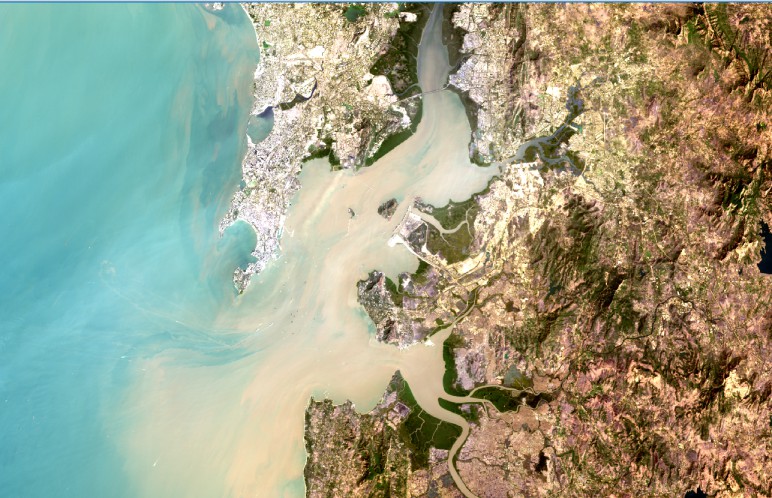
Landsat is without a doubt one of the best sources of free satellite data today. Managed by NASA and the United States Geological Survey, the Landsat satellites have been capturing multi-spectral imagery for over 40 years. The latest satellite, Landsat 8, orbits the Earth every 16 days and captures more than 700 satellite images per day across 9 spectral bands and 2 thermal bands. Its imagery has been used for everything from finding drought-prone areas and monitoring coastal erosion to analyzing an area’s fire probability and setting the best routes for electricity lines.
When we first started using Landsat 8 data, we were a bit overwhelmed by the amount of knowledge it took to find and download the images that we wanted. There are different types of data and data products, different APIs to figure out, data requests to be filled, differing data structures… it’s all a bit intimidating!
To make this data more accessible to everyone in our data team, we built an open-source R package (called rLandsat) to handle every step of finding, requesting, and downloading Landsat 8 data. Now we’re excited to release rLandsat to the public to help anyone unlock the mysteries within Landsat 8 data! Check out the rLandsat repository here.
About Landsat 8 data
The Landsat 8 Operational Land Imager (OLI) and Thermal Infrared Sensor (TIRS) images cover 9 spectral bands and 2 thermal bands with a spatial resolution ranging from 15 to 100 meters.
USGS gives access to both its raw and processed satellite images. Raw images are available on AWS S3 and Google Cloud Storage, where they can be downloaded immediately. Processed images are available with the EROS Science Processing Architecture (ESPA). Images are also available through a variety of data products, such as SR (Surface Reflectance), TOA (Top of Atmosphere) and BR (Brightness Temperature).
Accessing the processed data can be tricky. There are two different APIs — one by Development Seed for searching (called sat-api) and one by USGS for downloading (called espa-api). Download requests have to include the product ID, row and/or path for the data, then they must be approved by USGS, which can take anywhere from a couple minutes to a couple days. To make matters worse, the APIs input and output data with different structures.
Here are some additional resources you might want to read:
- Read about the Landsat Collection (Pre Collection and Collection 1) here.
- Watch this video to understand the difference between the data on ESPA and that on AWS S3/Google Cloud Storage, and why using ESPA is preferred over AWS’ Digital Numbers (DN).
- Watch how the data is captured here.
- Read about over 120 applications of Landsat 8 data here.
Overview of rLandsat
rLandsat is an R package that handles every step of finding and getting Landsat 8 data — no Python or API knowledge needed! It makes it easy to search for Landsat8 product IDs, place an order on USGS-ESPA and download the data along with the meta information in the perfect format from R.
Internally, it uses a combination of sat-api, espa-api and AWS S3 Landsat 8 metadata.
To run any of the functions starting with espa_, you need valid login credentials from ESPA-LSRD and you need to input them in your environment with espa_creds(username, password) for the functions to work properly.
You should also check the demo script (which downloads all the Landsat 8 data for India for January 2018) in the demo folder, or run demo("india_landsat") in R after loading this library.
What can you do on rLandsat?
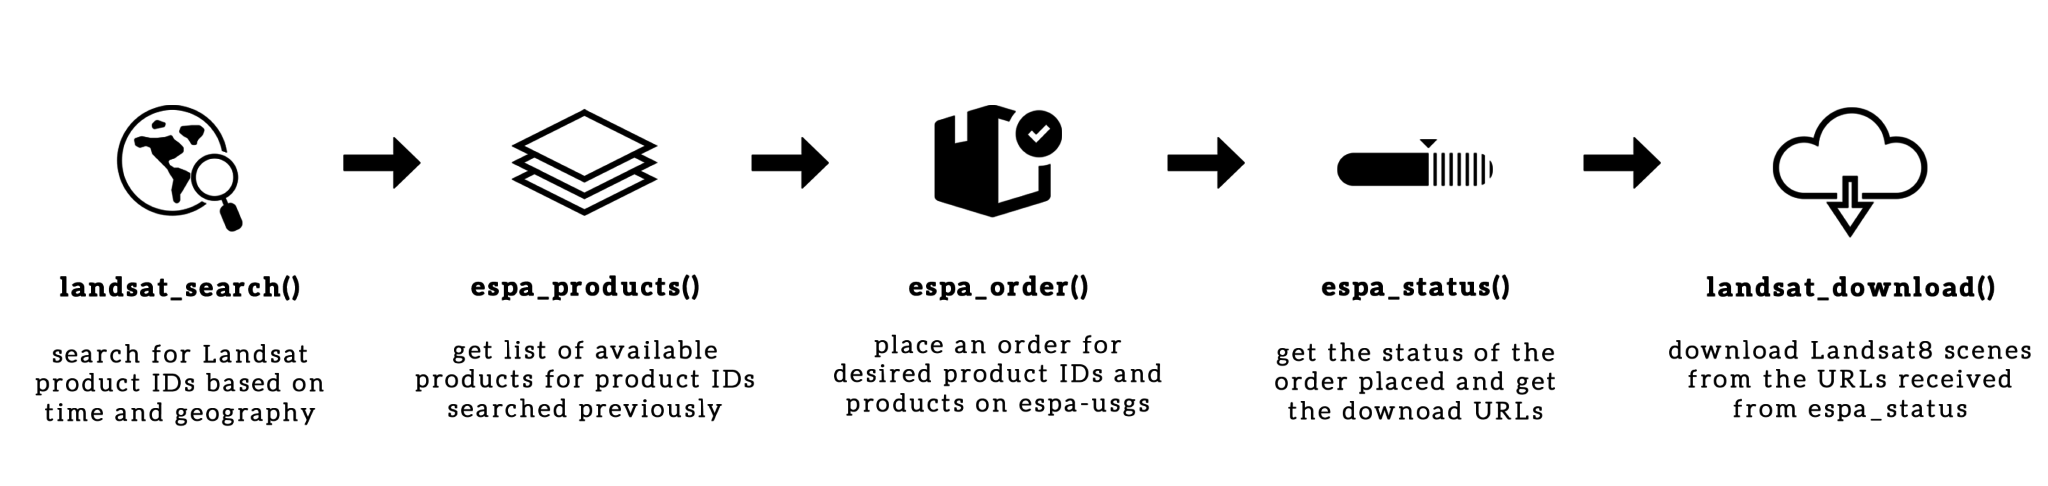
landsat_search: Get Landsat 8 product IDs for certain time periods and countries (or define your own path and row). This search uses sat-api (developed by DevelopmentSeed, this also gives the download URLs for AWS S3) or the AWS Landsat master meta file, based on your input.espa_product: For the specified Landsat 8 product IDs, get the products available from ESPA. This uses espa-api.espa_order: Place an order to get the download links for the specified product IDs and the corresponding products. You can also specify the projection (AEA and Lon/Lat), the resampling method and the file format. This is better than downloading the data from AWS as this gives data from advanced products (like Surface Reflectance), which is necessary for creating most of the indices.espa_status: Get the status of the order placed usingespa_order. If the status is complete, the download URLs for each tile will also be available.landsat_download: A small function to download multiple URLs using thedownload.filefunction. If each band is being downloaded individually from AWS, this function will create a folder (instead of a zip file) for each tile, grouping the bands.
How to install rLandsat
If you find a bug, please file an issue with steps to reproduce it on Github. Please use the same for any feature requests, enhancements or suggestions.
Example
References
- sat-api (Development Seed): https://github.com/sat-utils/sat-api
- espa-api (USGS-EROS): https://github.com/USGS-EROS/espa-api/
- Google Server and AWS Landsat Data: http://krstn.eu/landsat-batch-download-from-google/
- rLandsat repository: https://github.com/socialcopsdev/rLandsat
Cheers to open data ![]()
