WHAT AM I UPTO?
Yeah! I finally found data to which I could relate to. Recently, I have been working mostly on the flight prediction project, which involves intense coding and thinking, so I was looking for something for fun. This data set was perfect, as I have been a cricket fan (like the million other in India) from childhood. Found the data of each ball and every match of IPL for every season in Kaggle, and there are infinite things you can do with this information. I wanted to continue to work on this, but time was the constraint so forced myself with this. There are some very interesting facts which one can deduce from this.
Data link: IPL Analysis (deliveries, matches)
I am just trying to study the overall trend and dig for interesting insights. Hence I have implemented the following:
1. Analysing the overall trend in IPL and also the team performances.
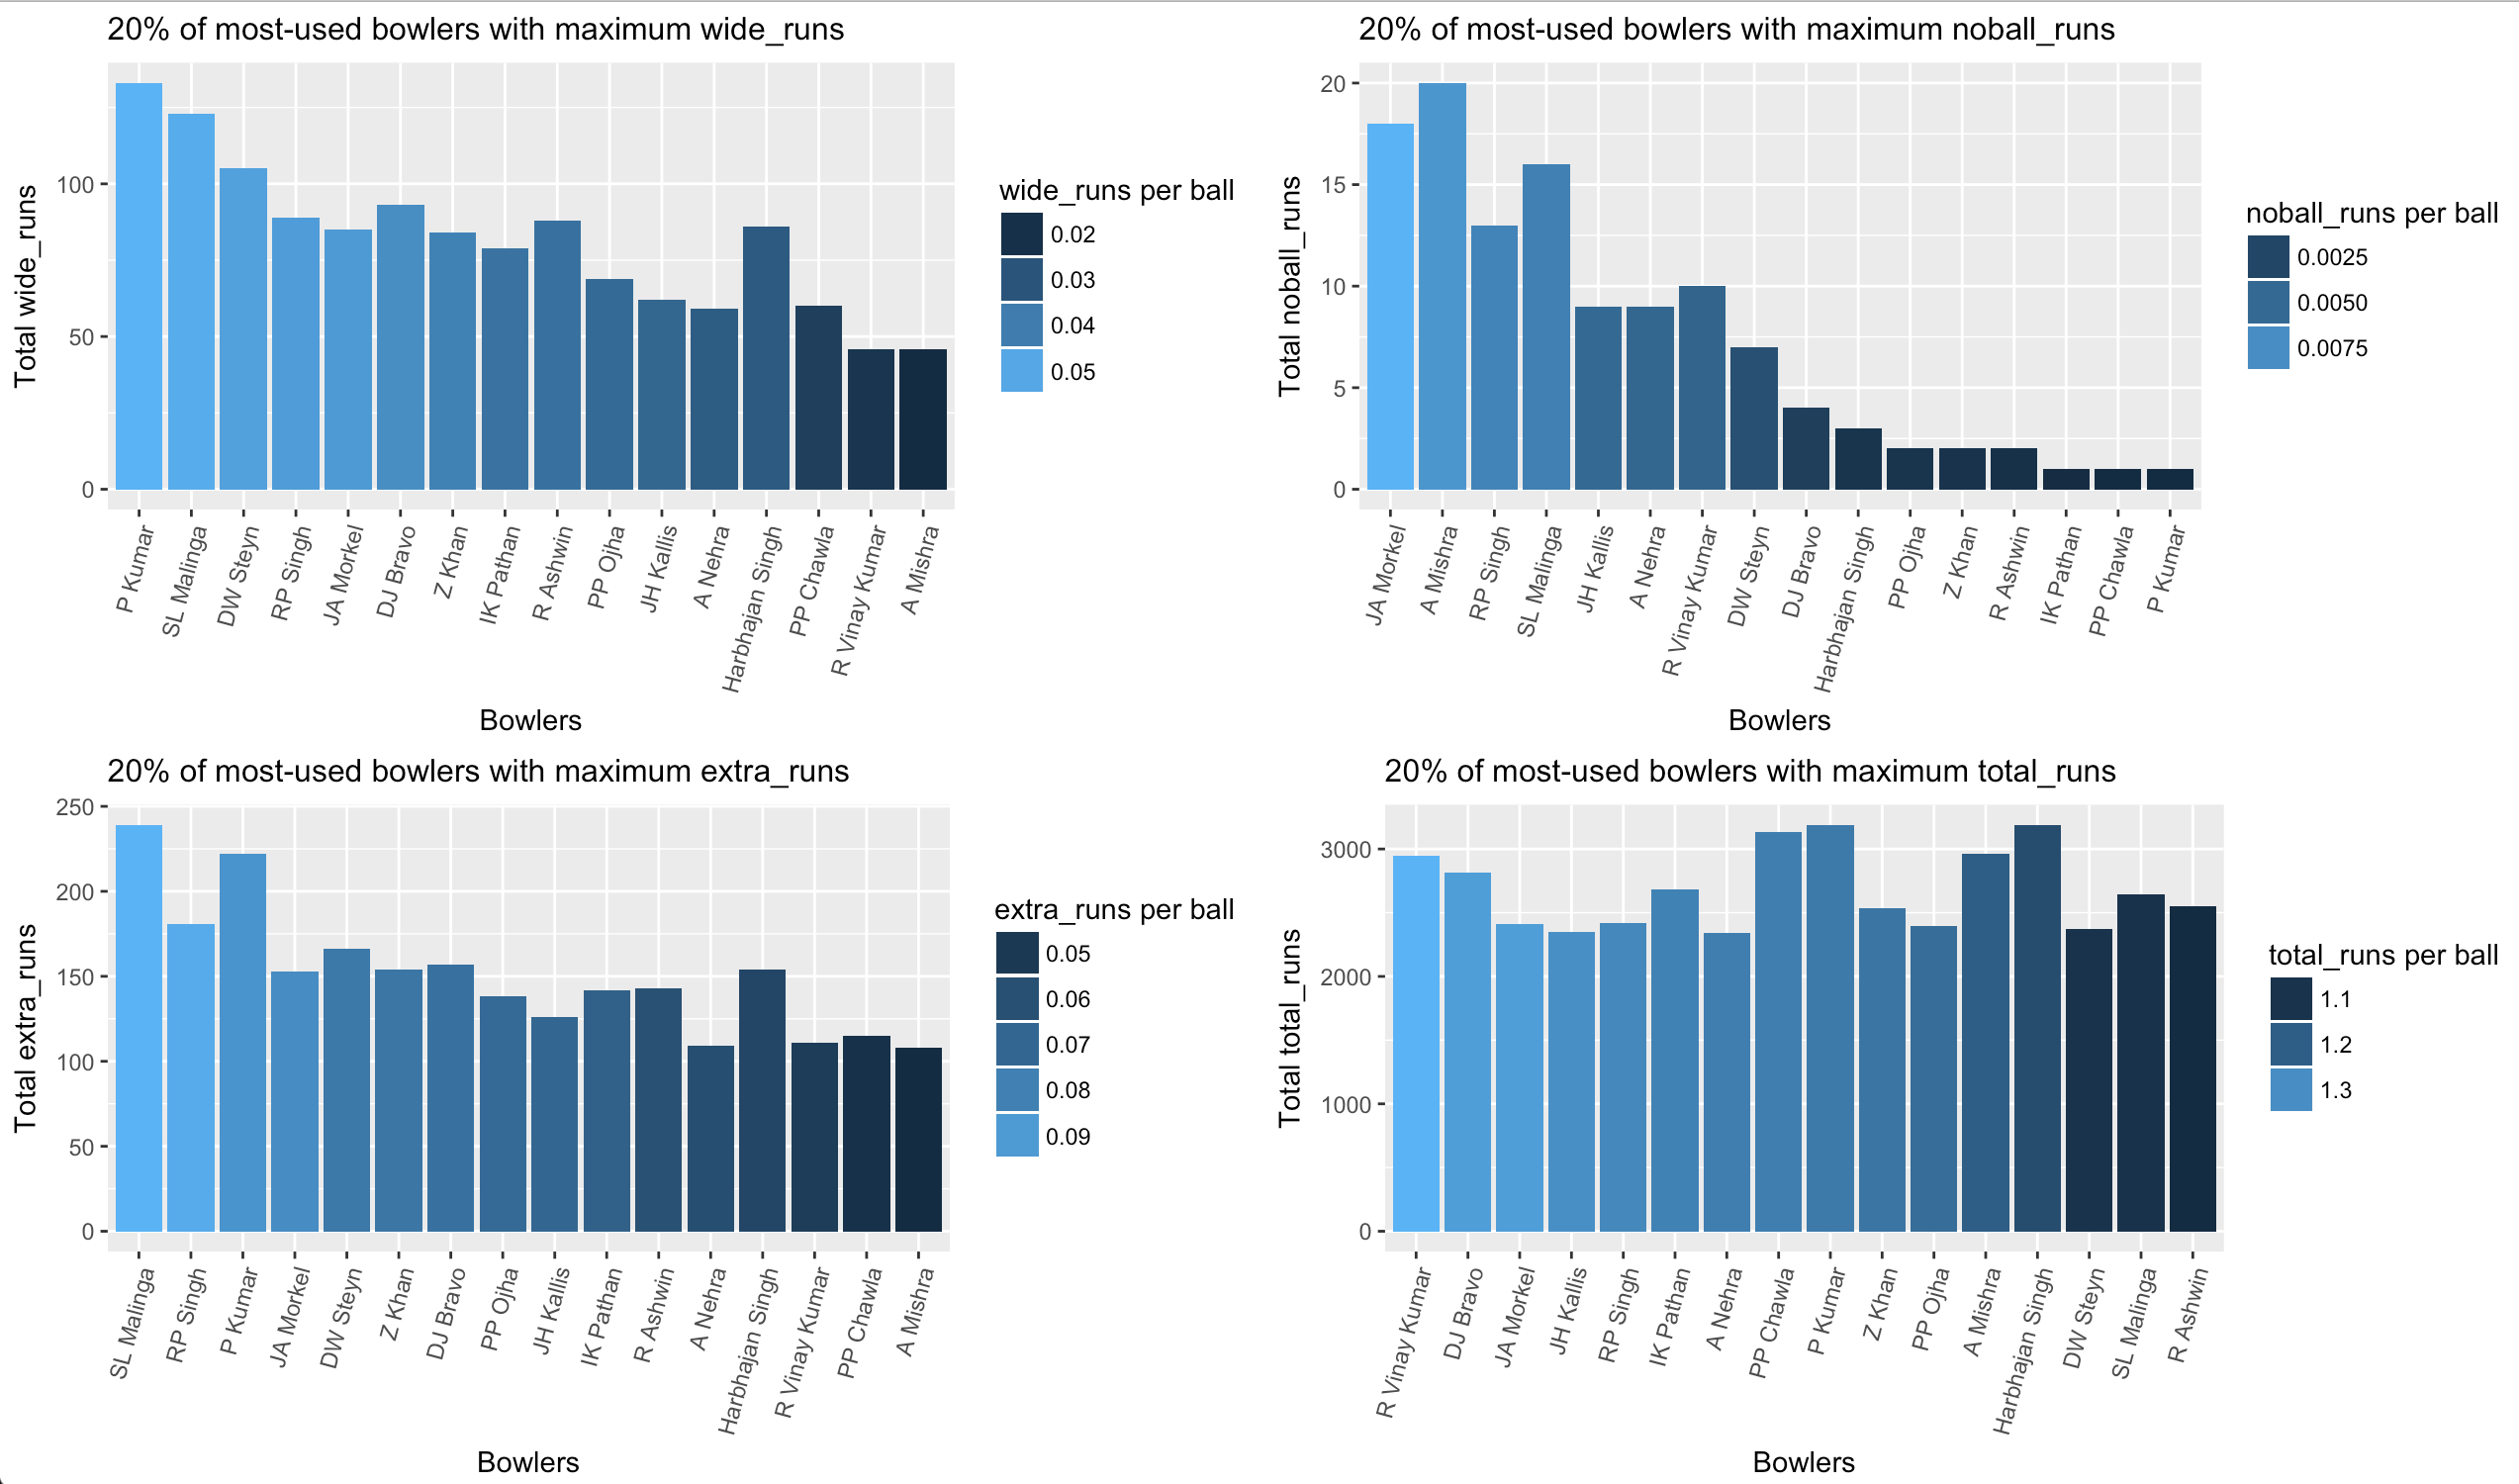
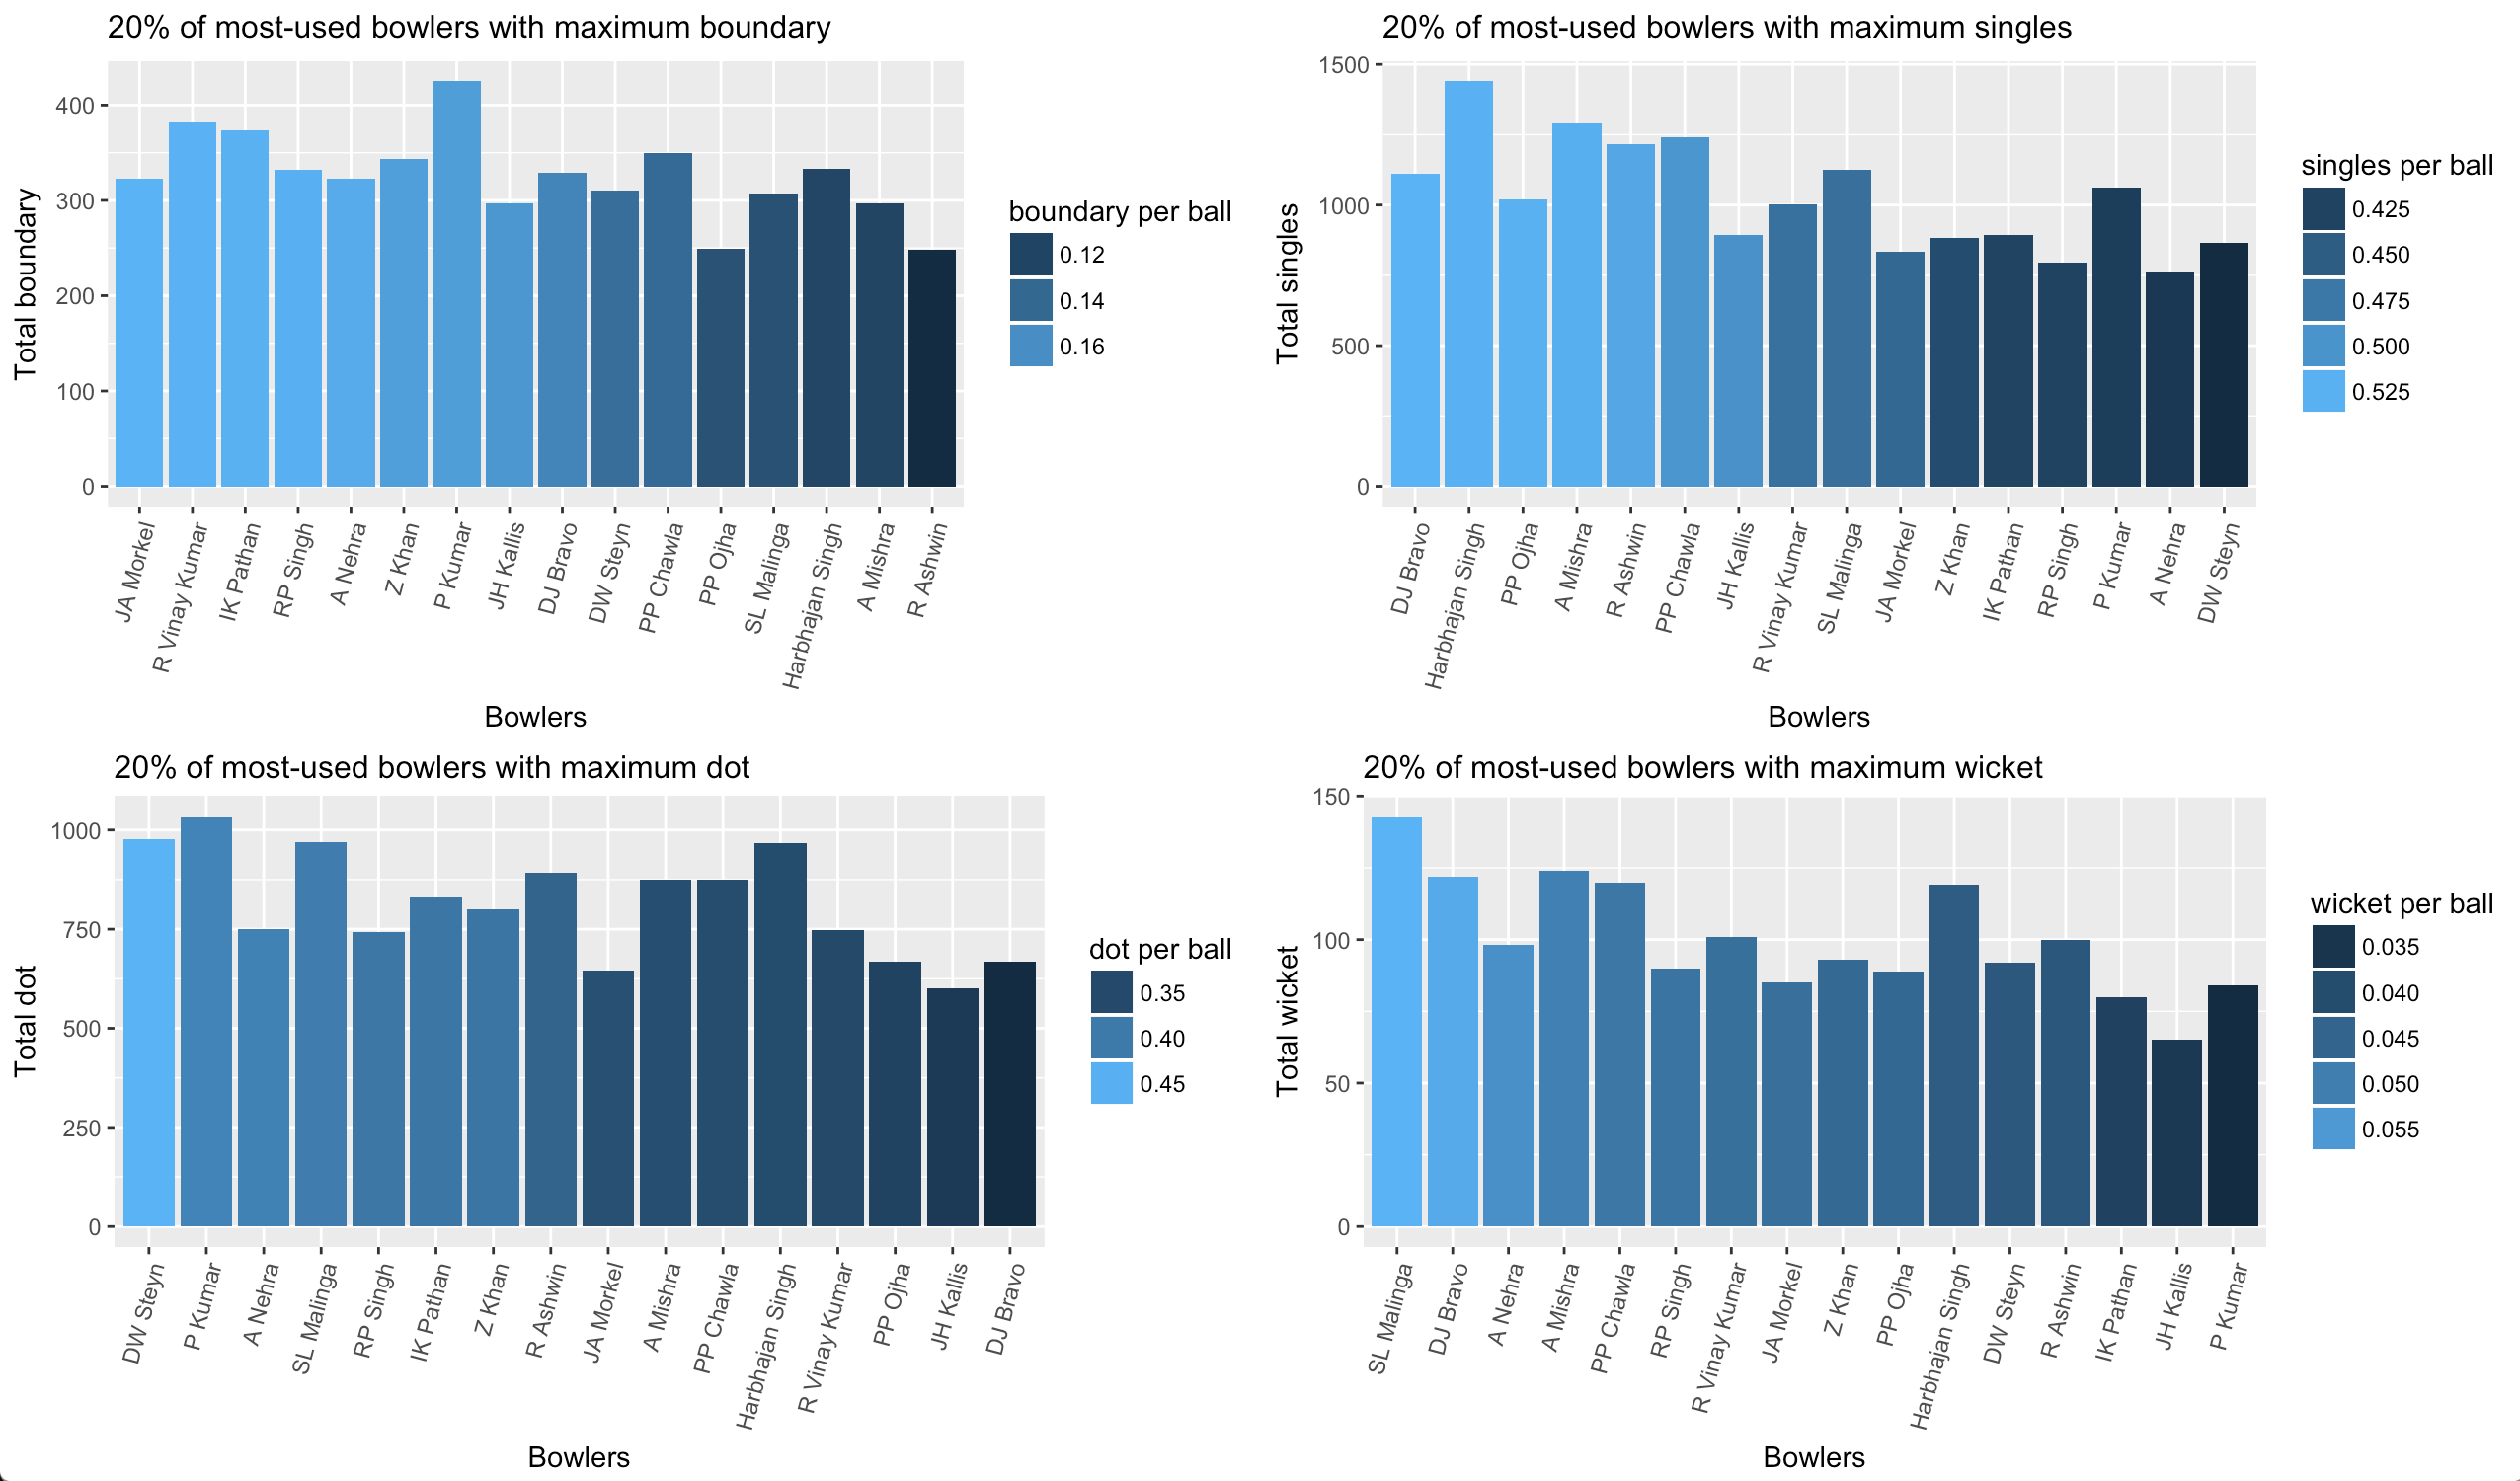
2. 20% of most used bowlers
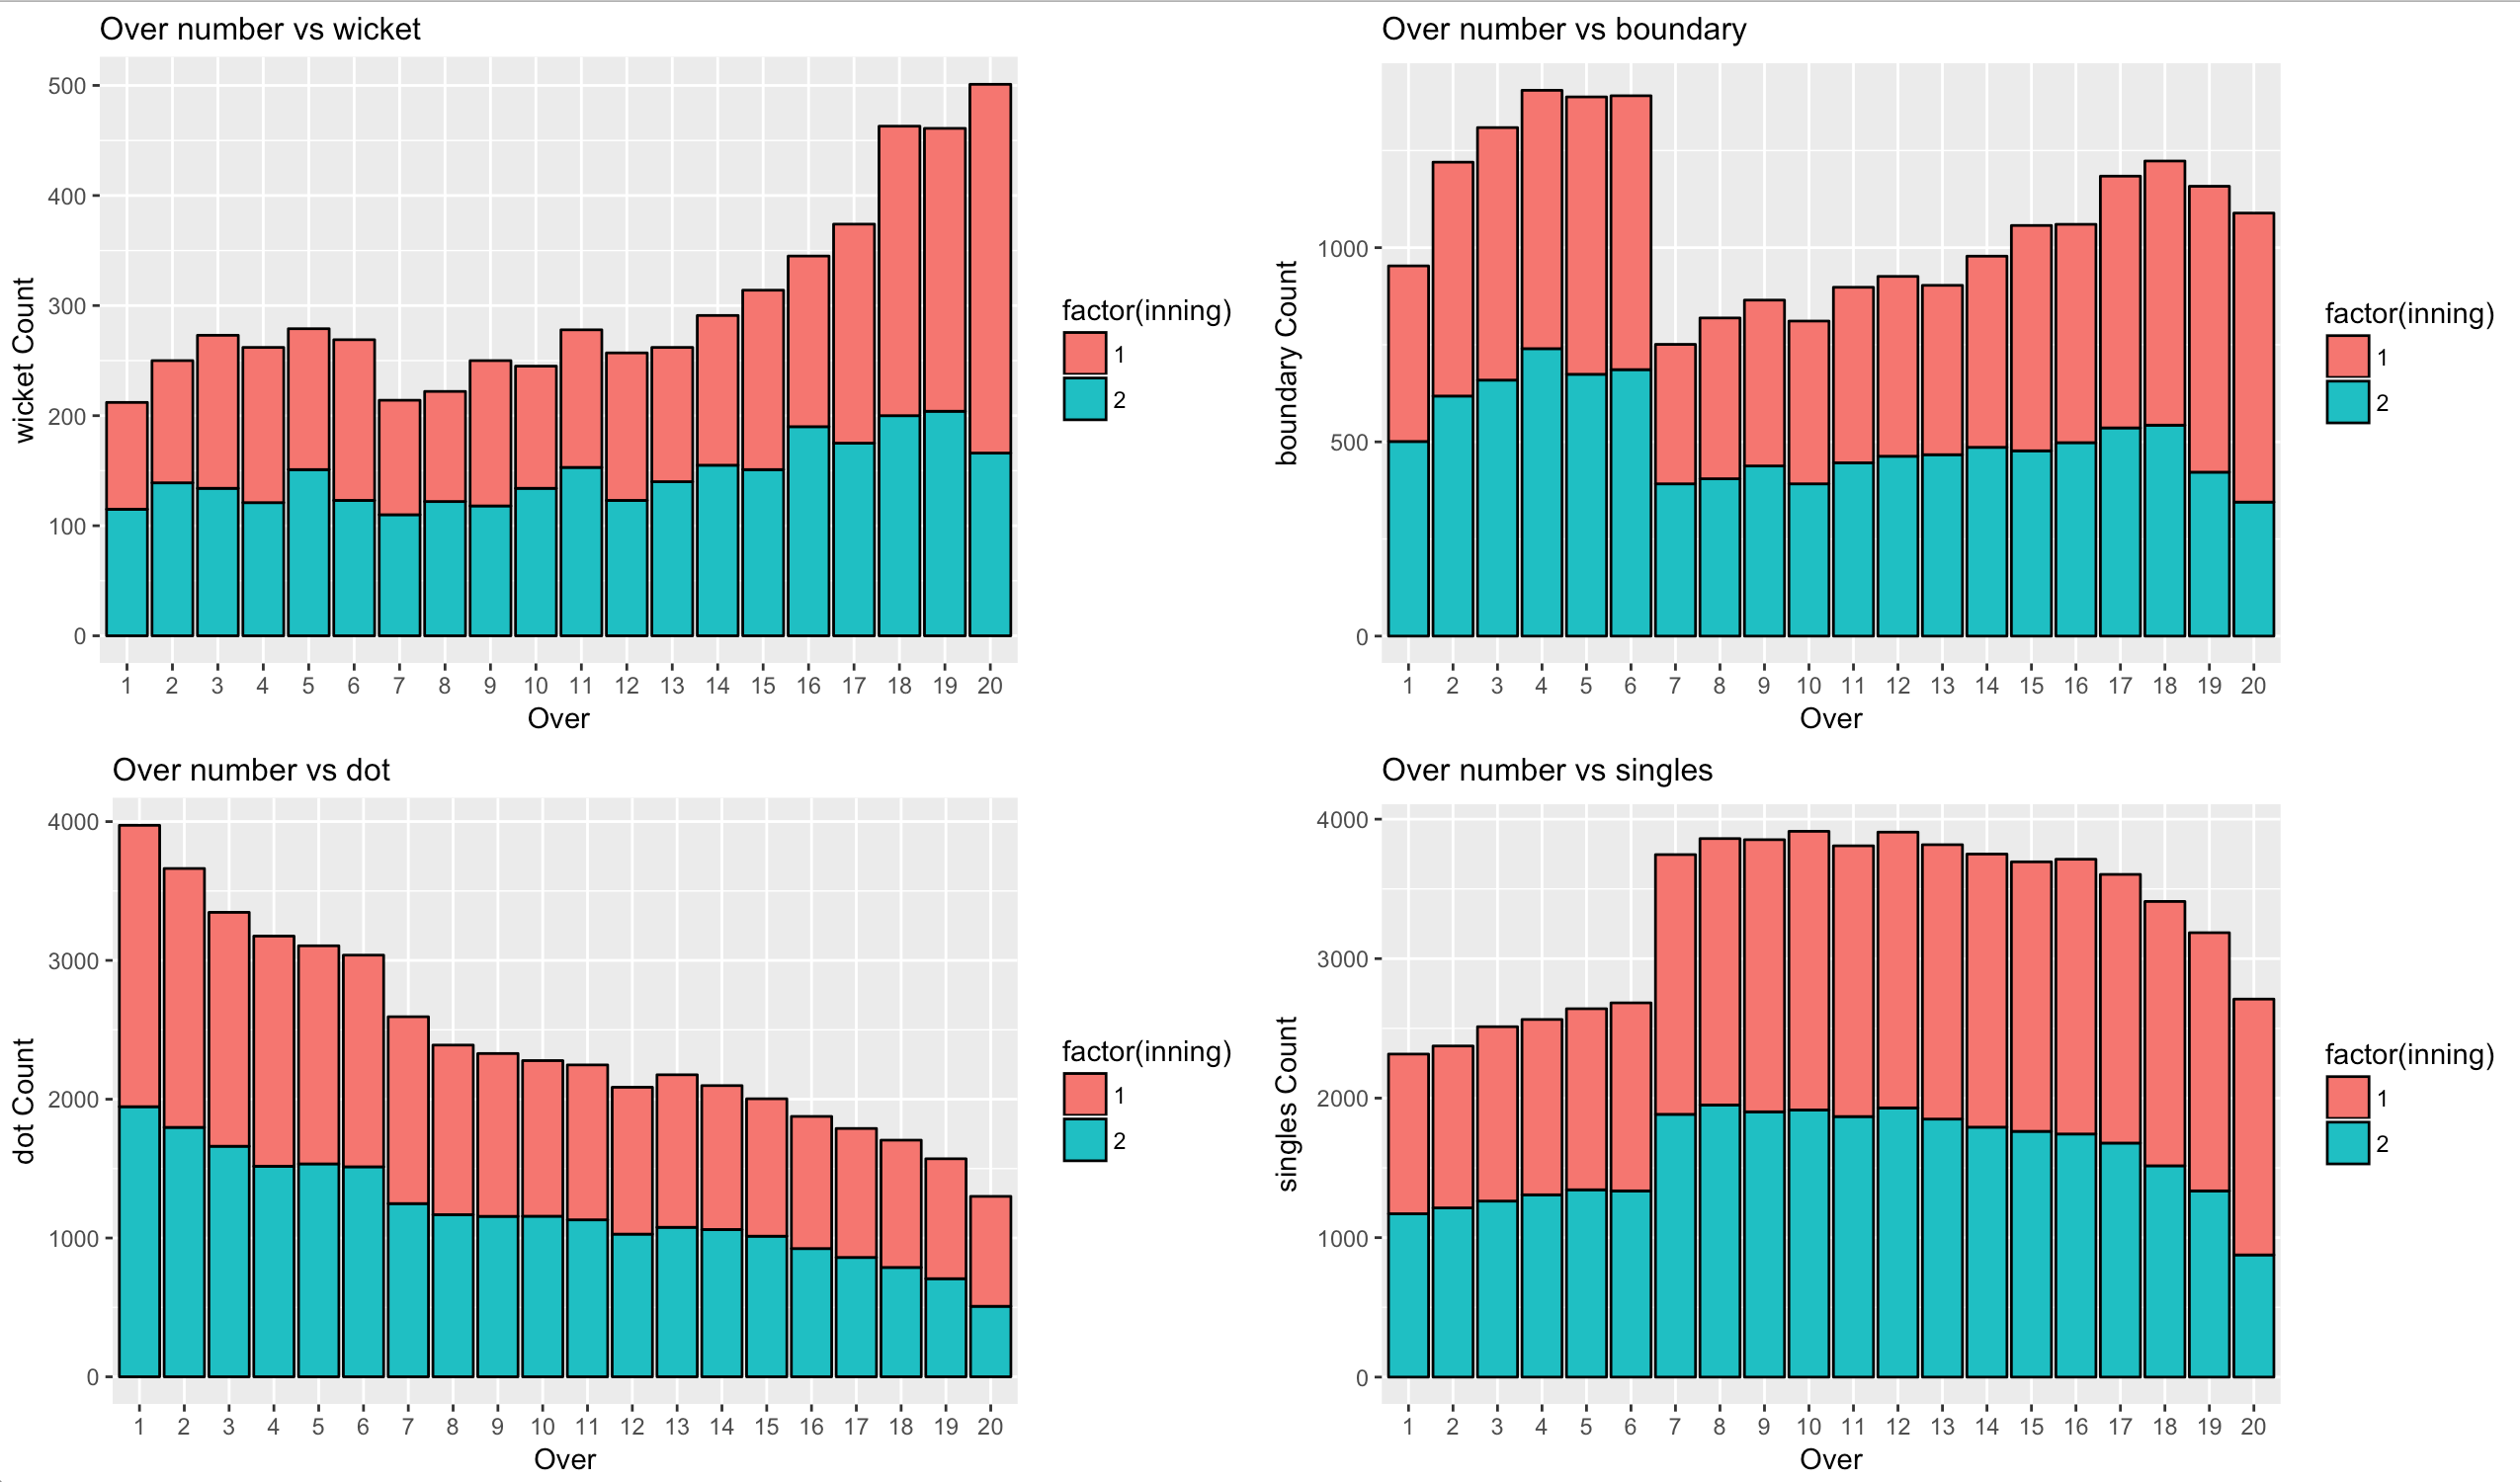
3. General trend by overs
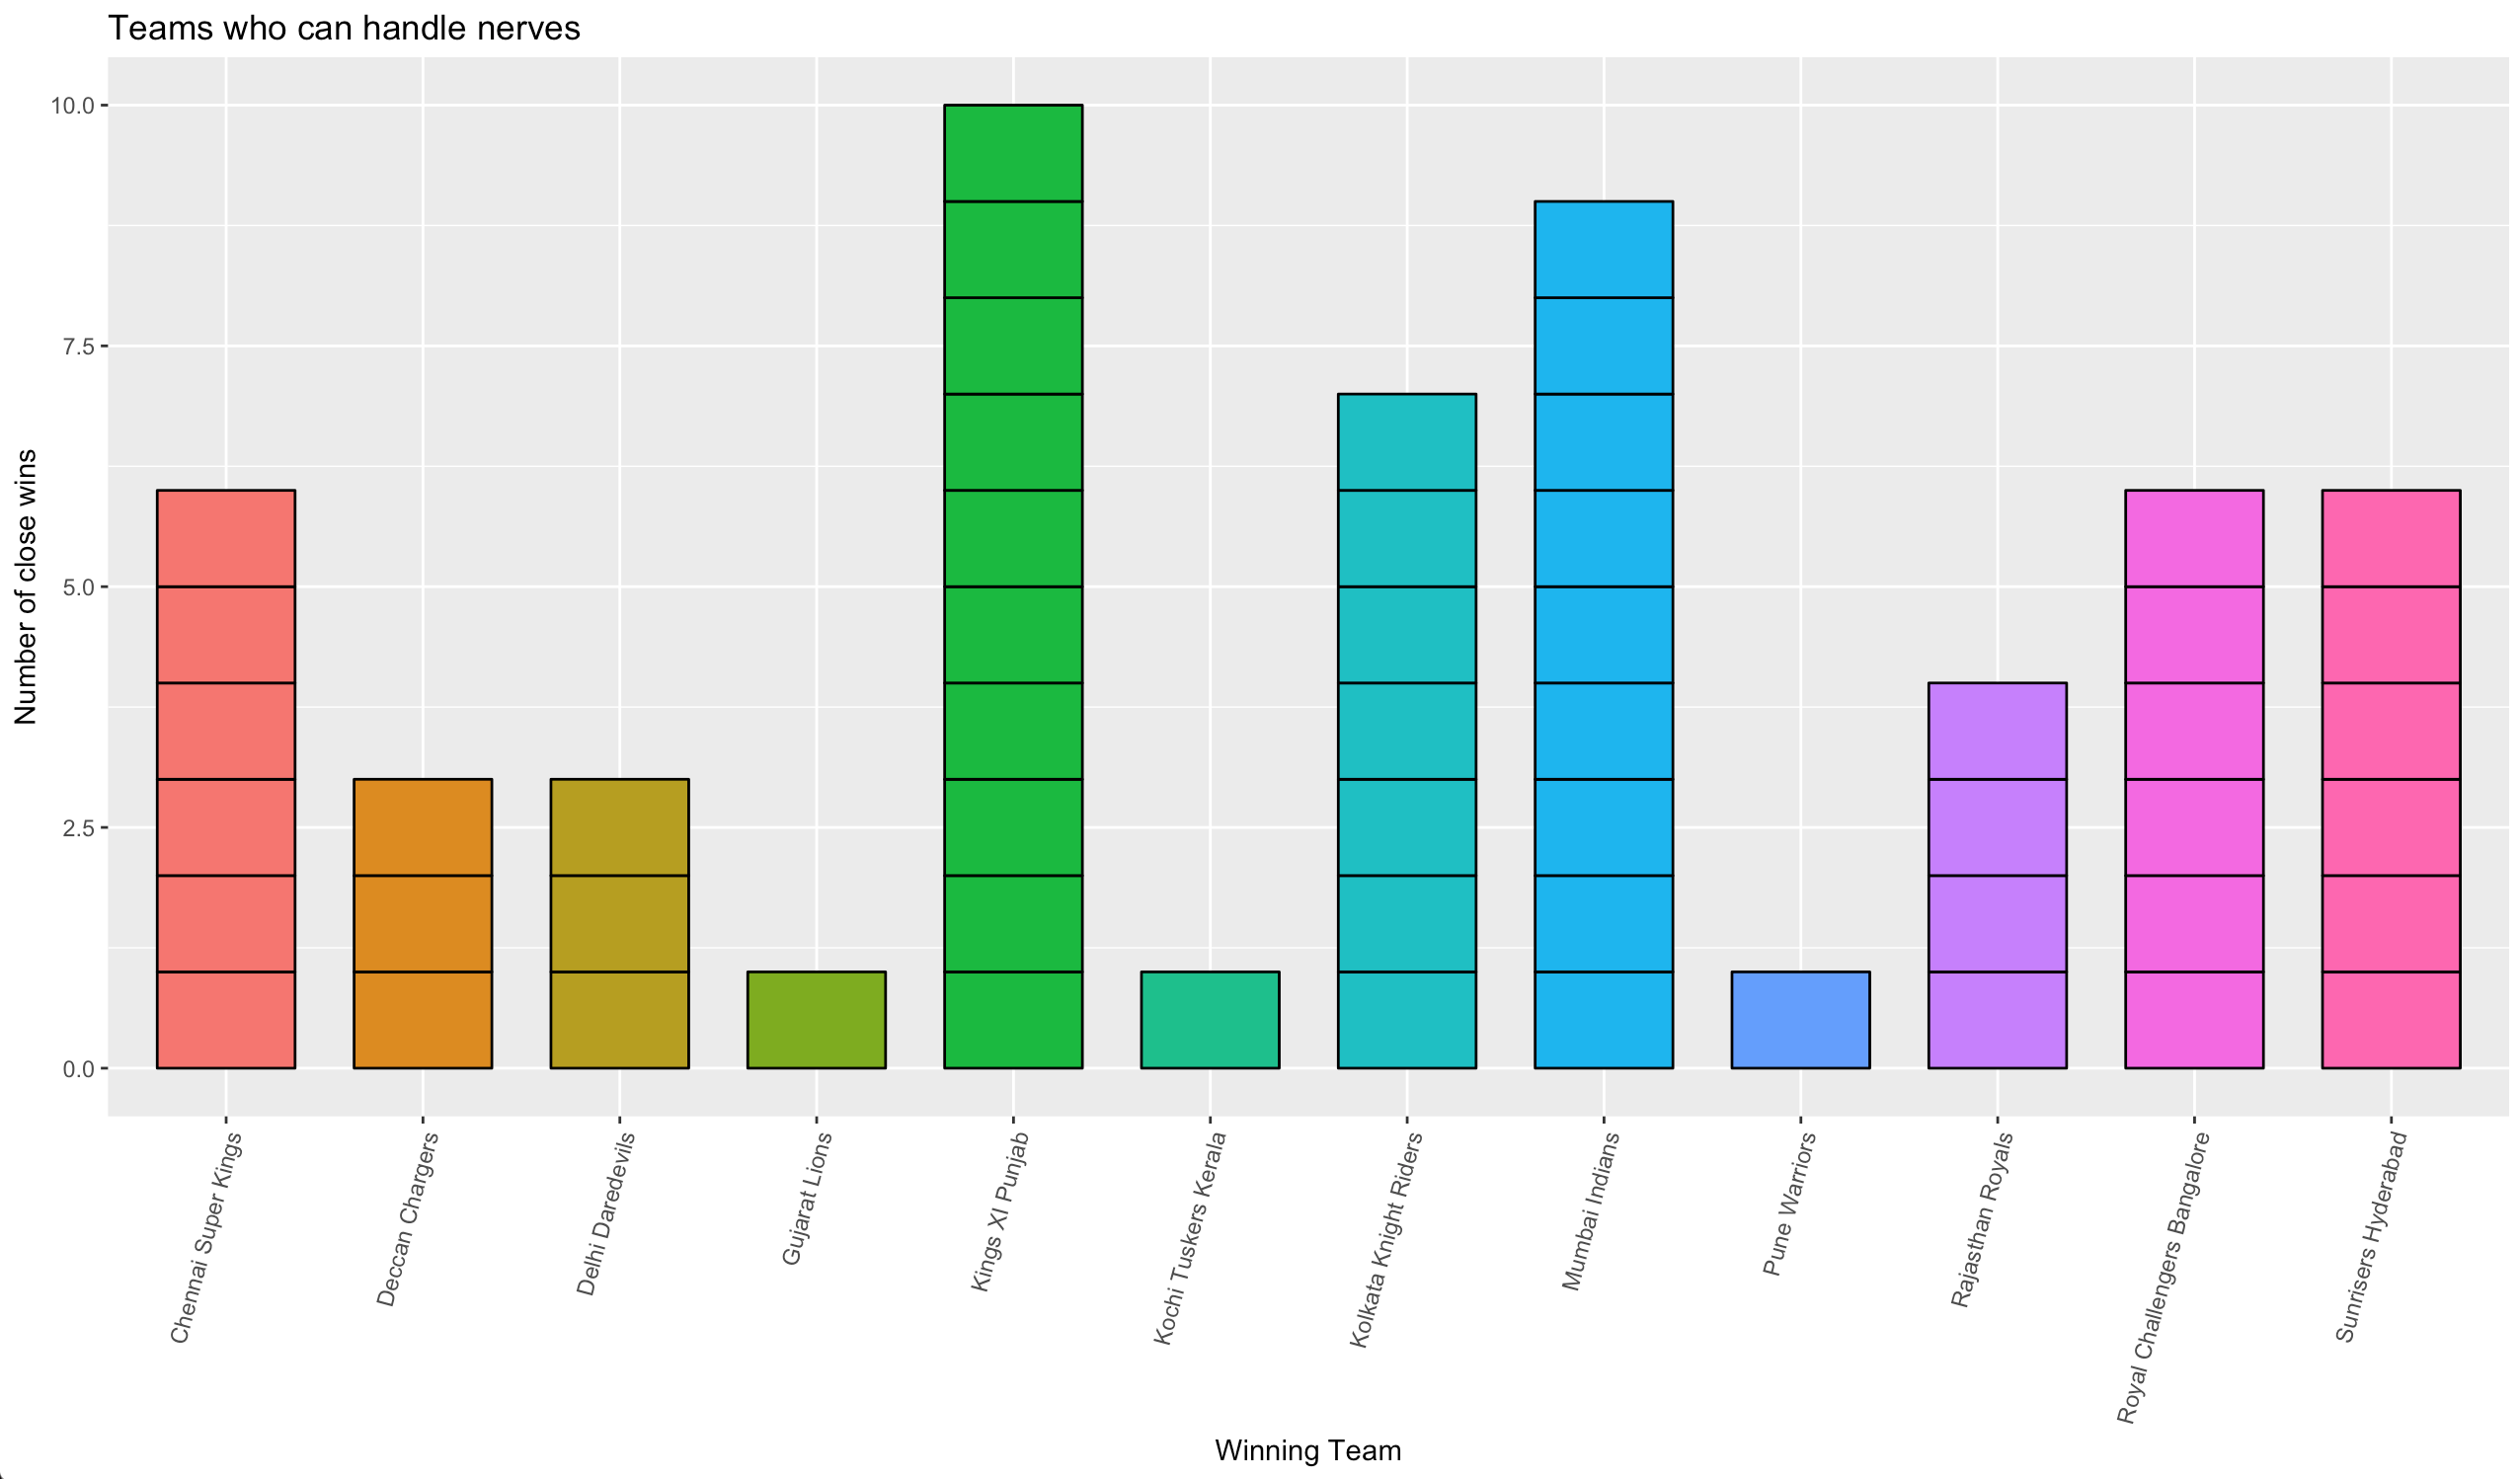
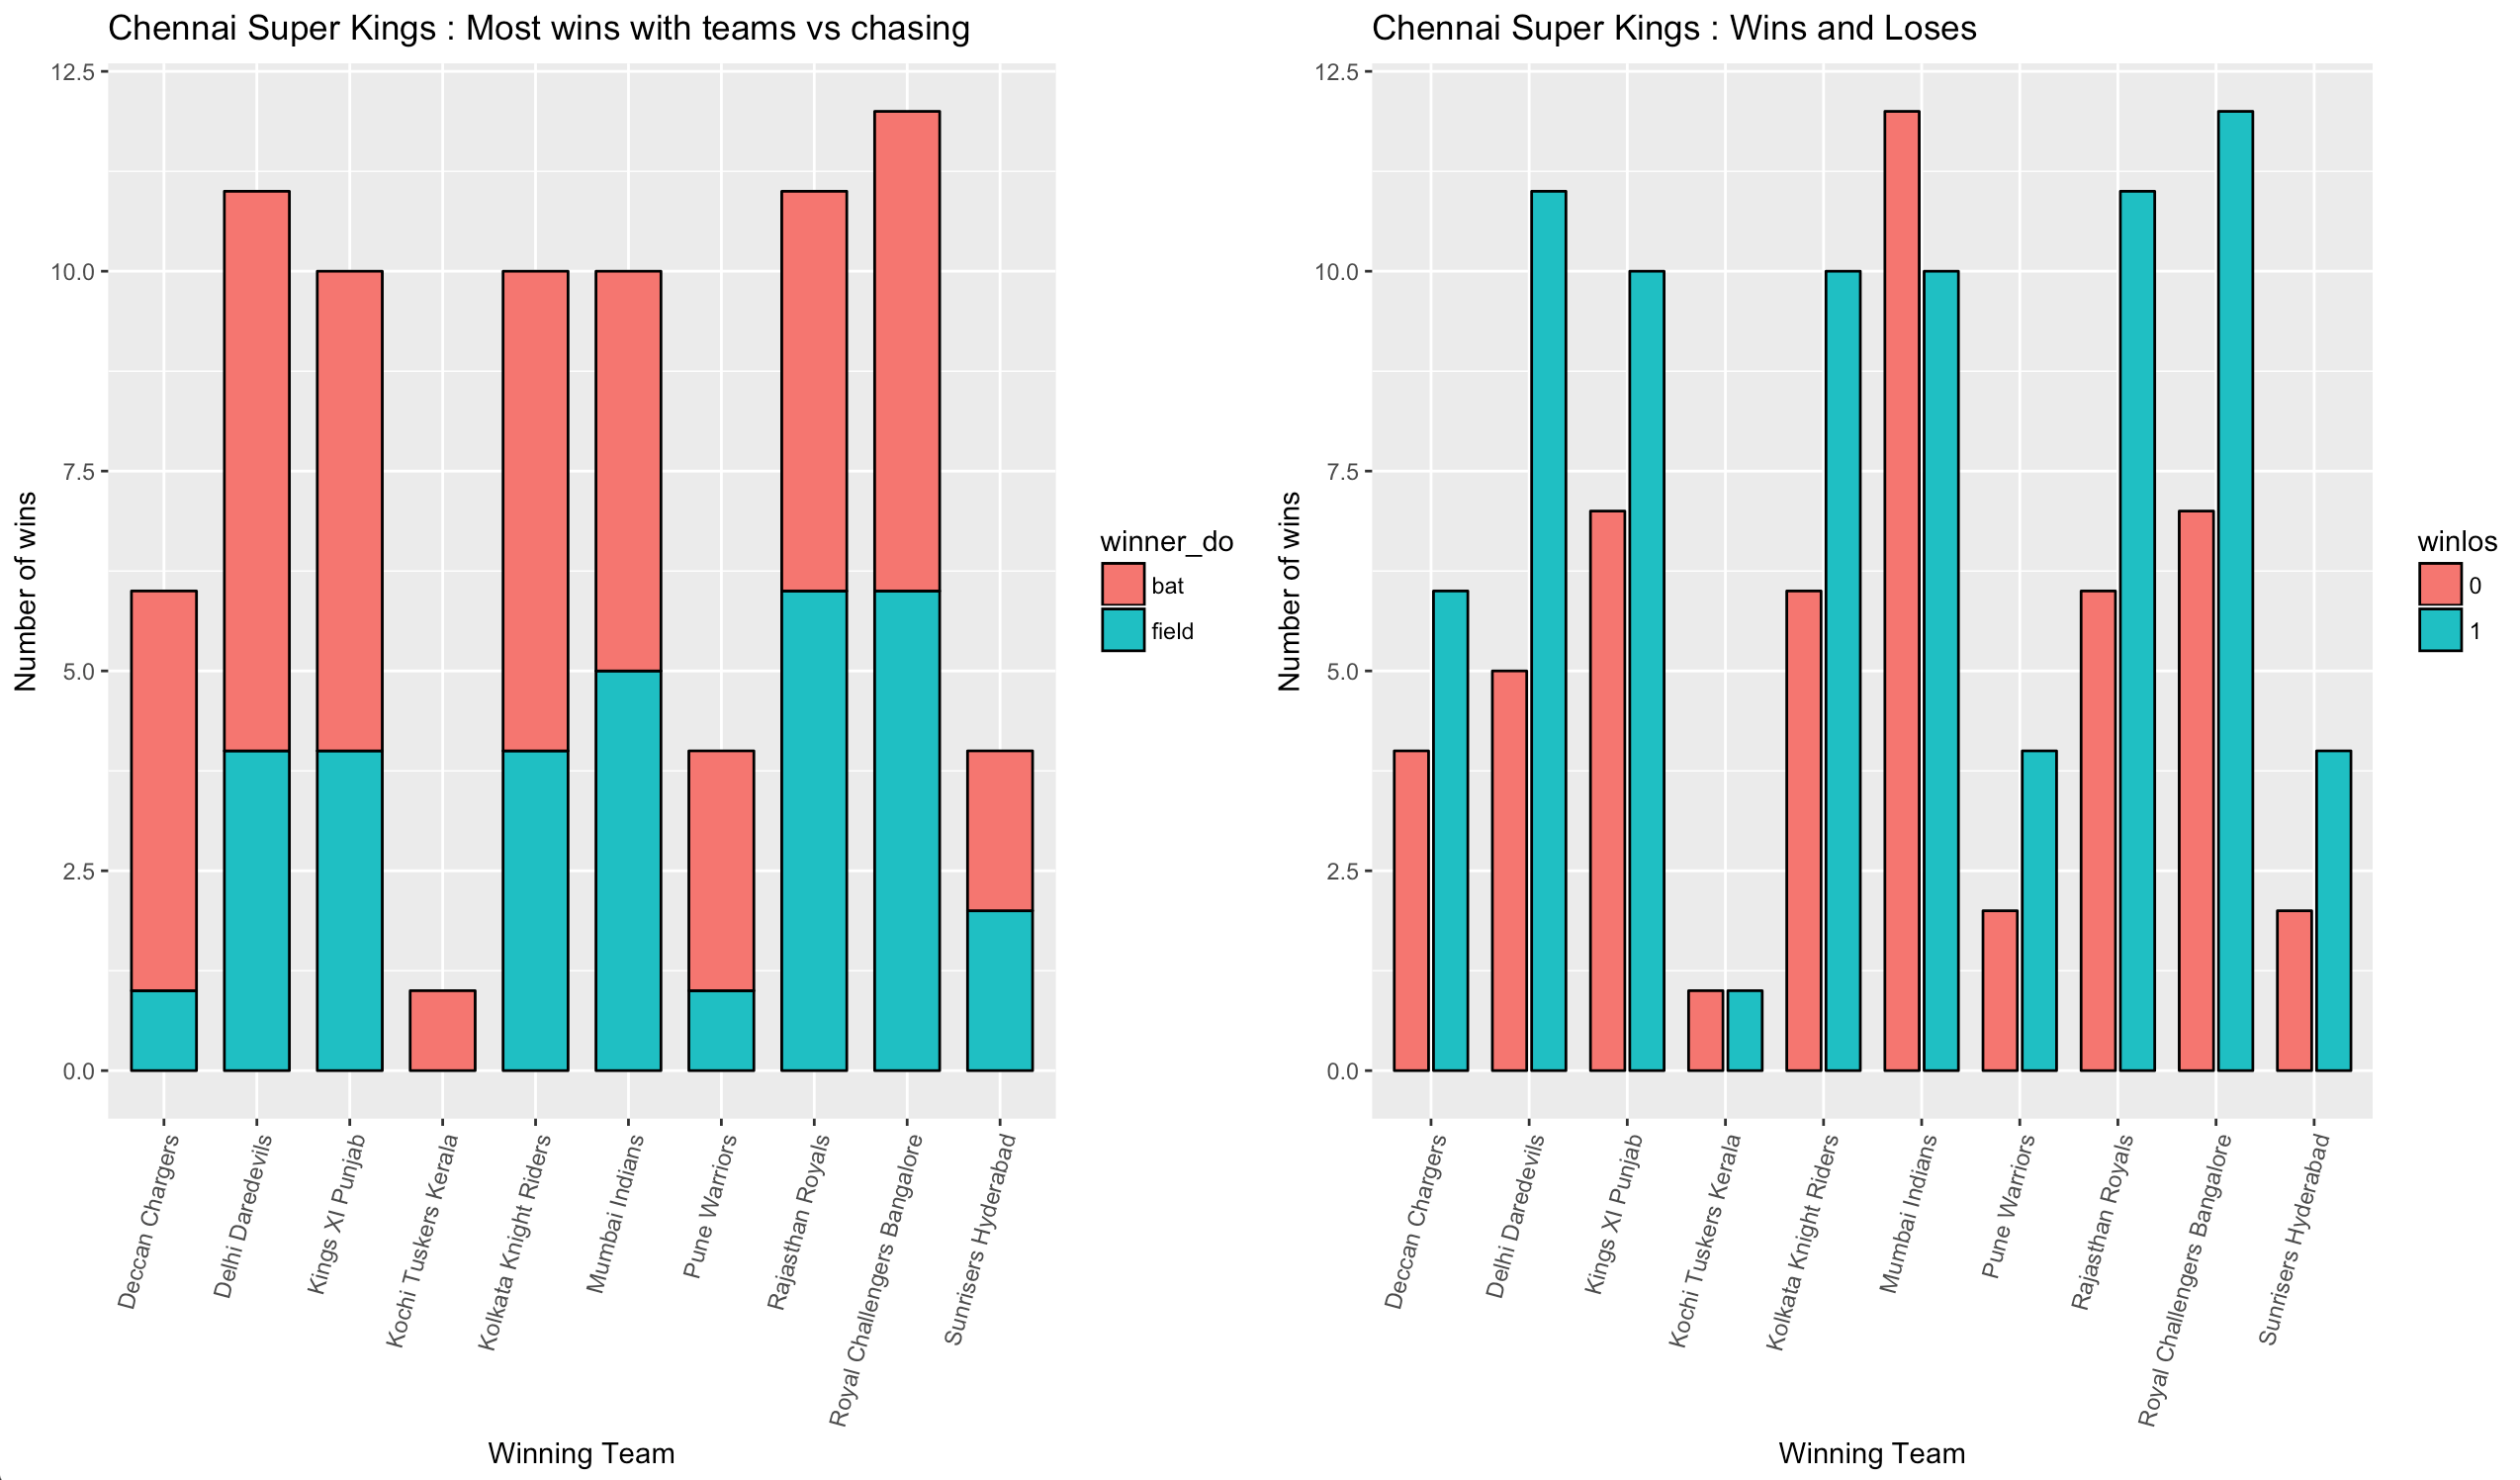
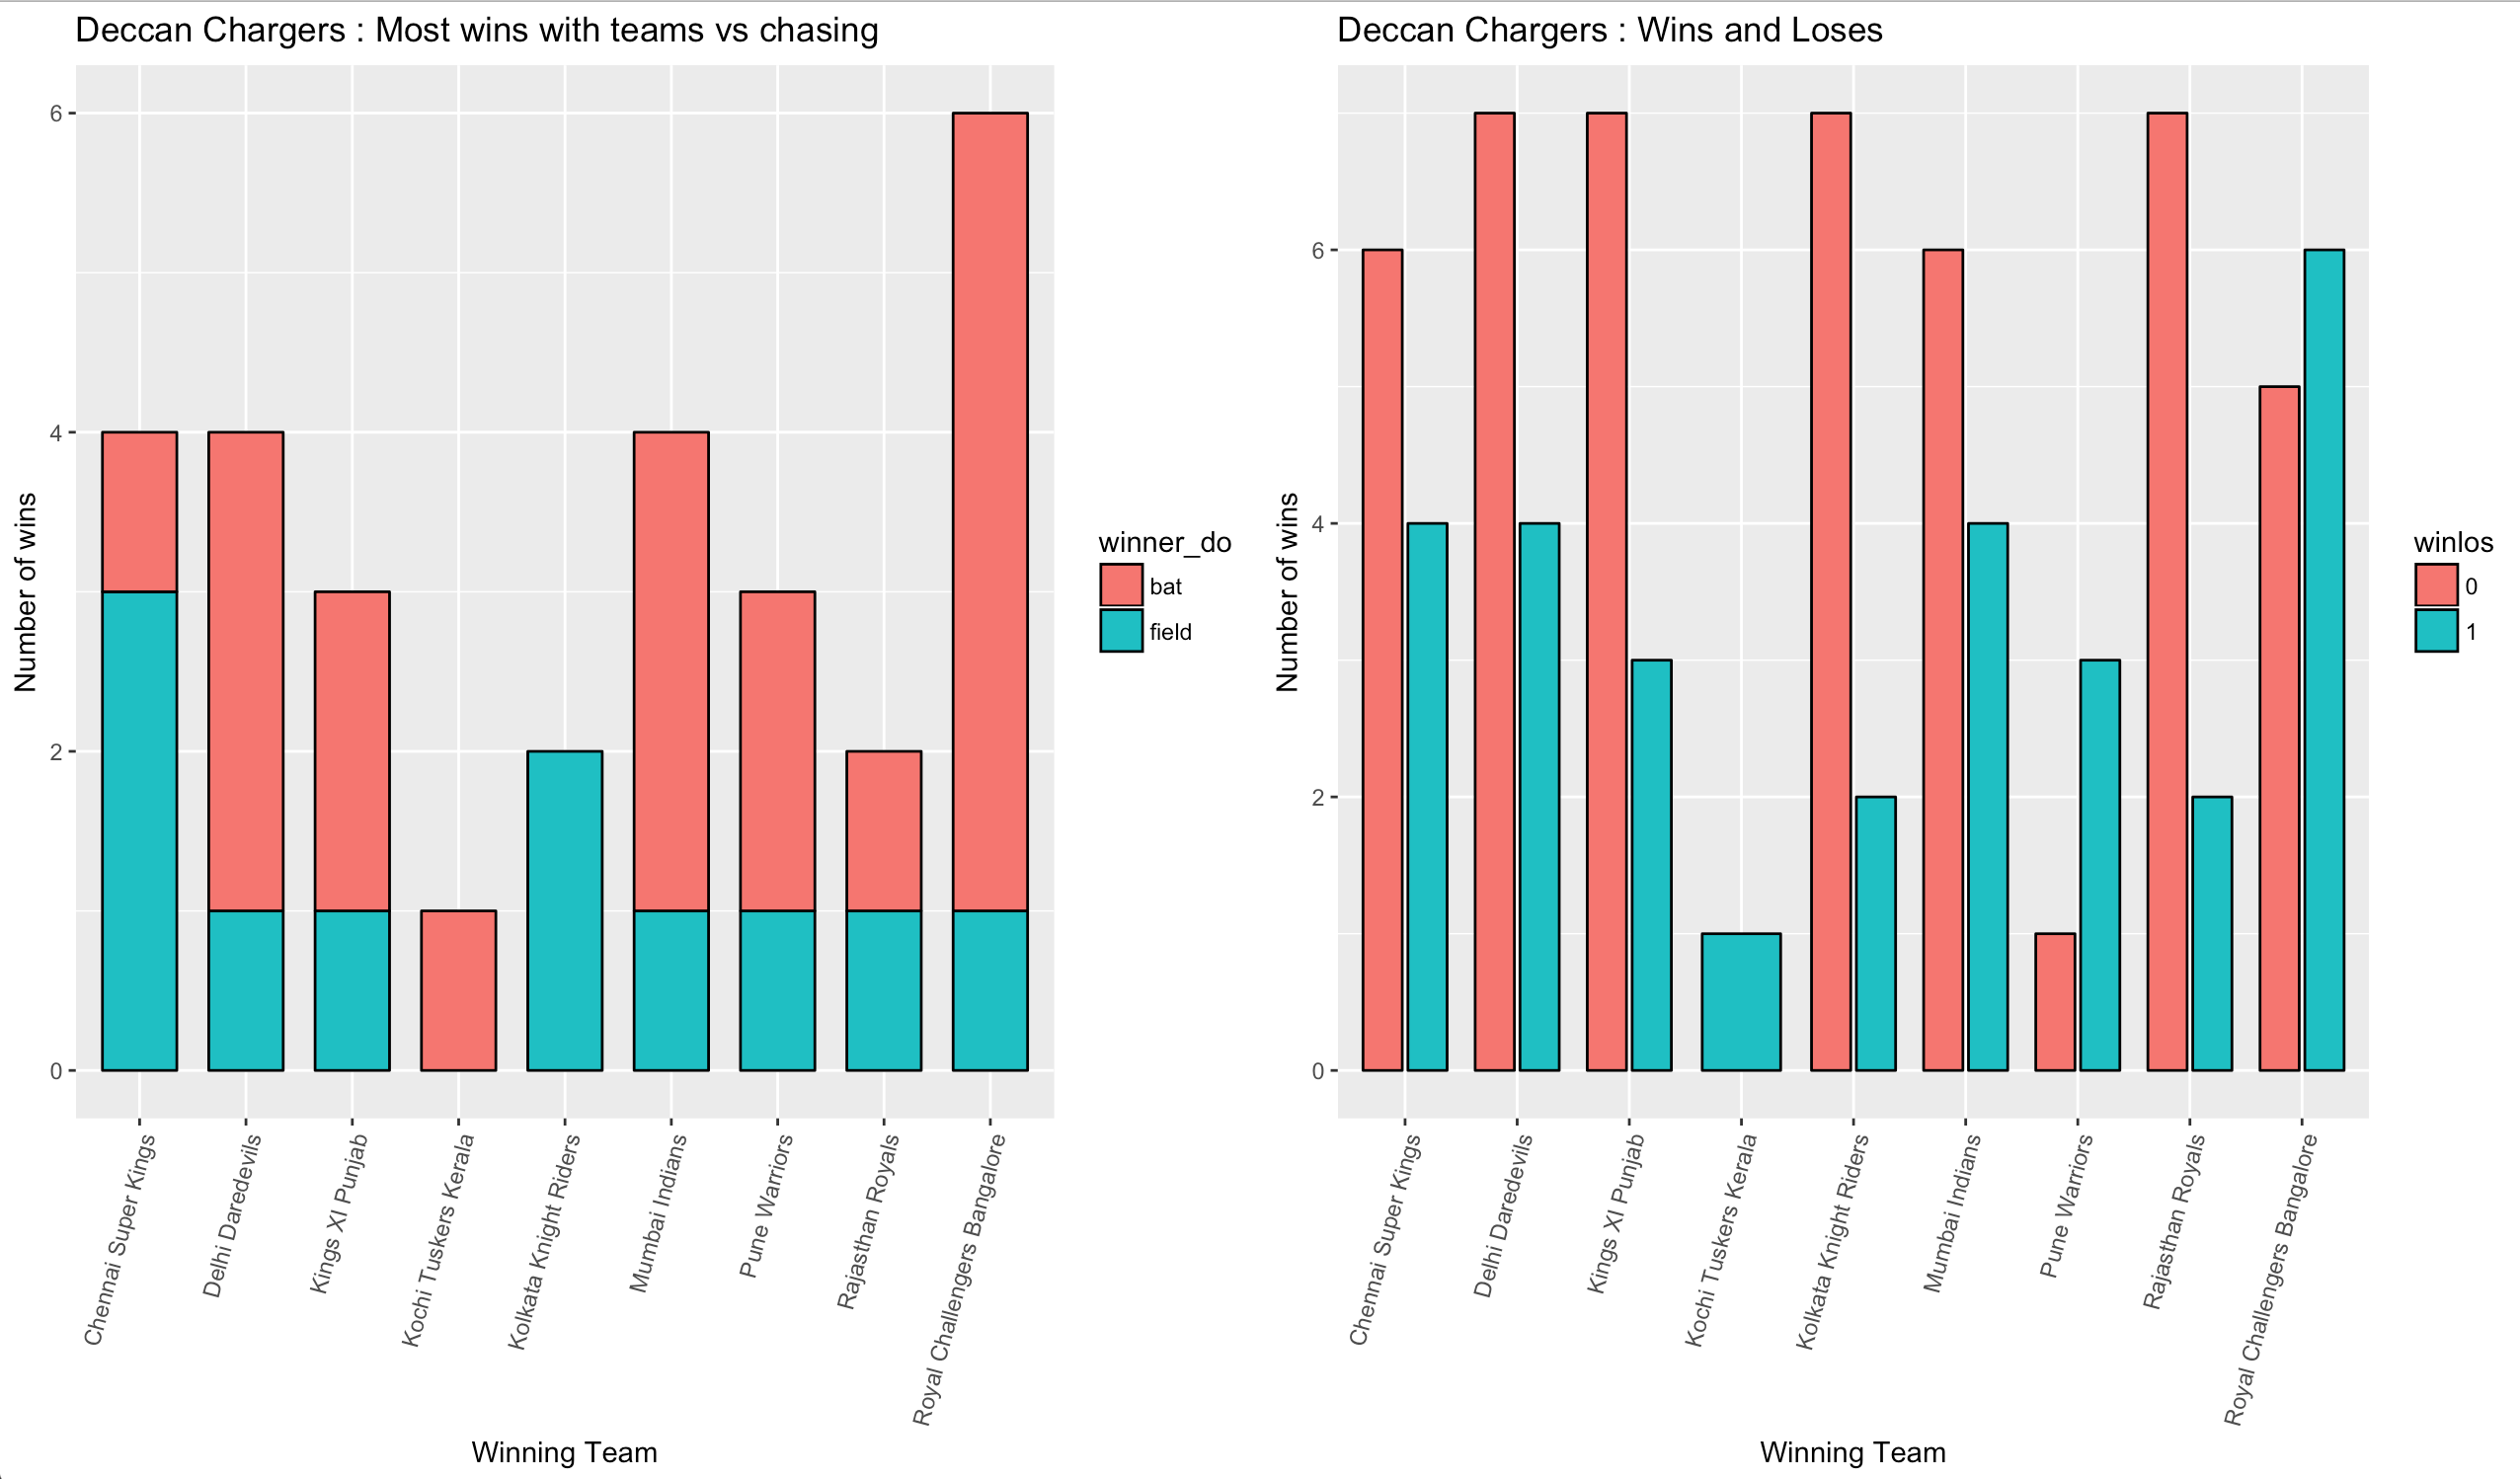
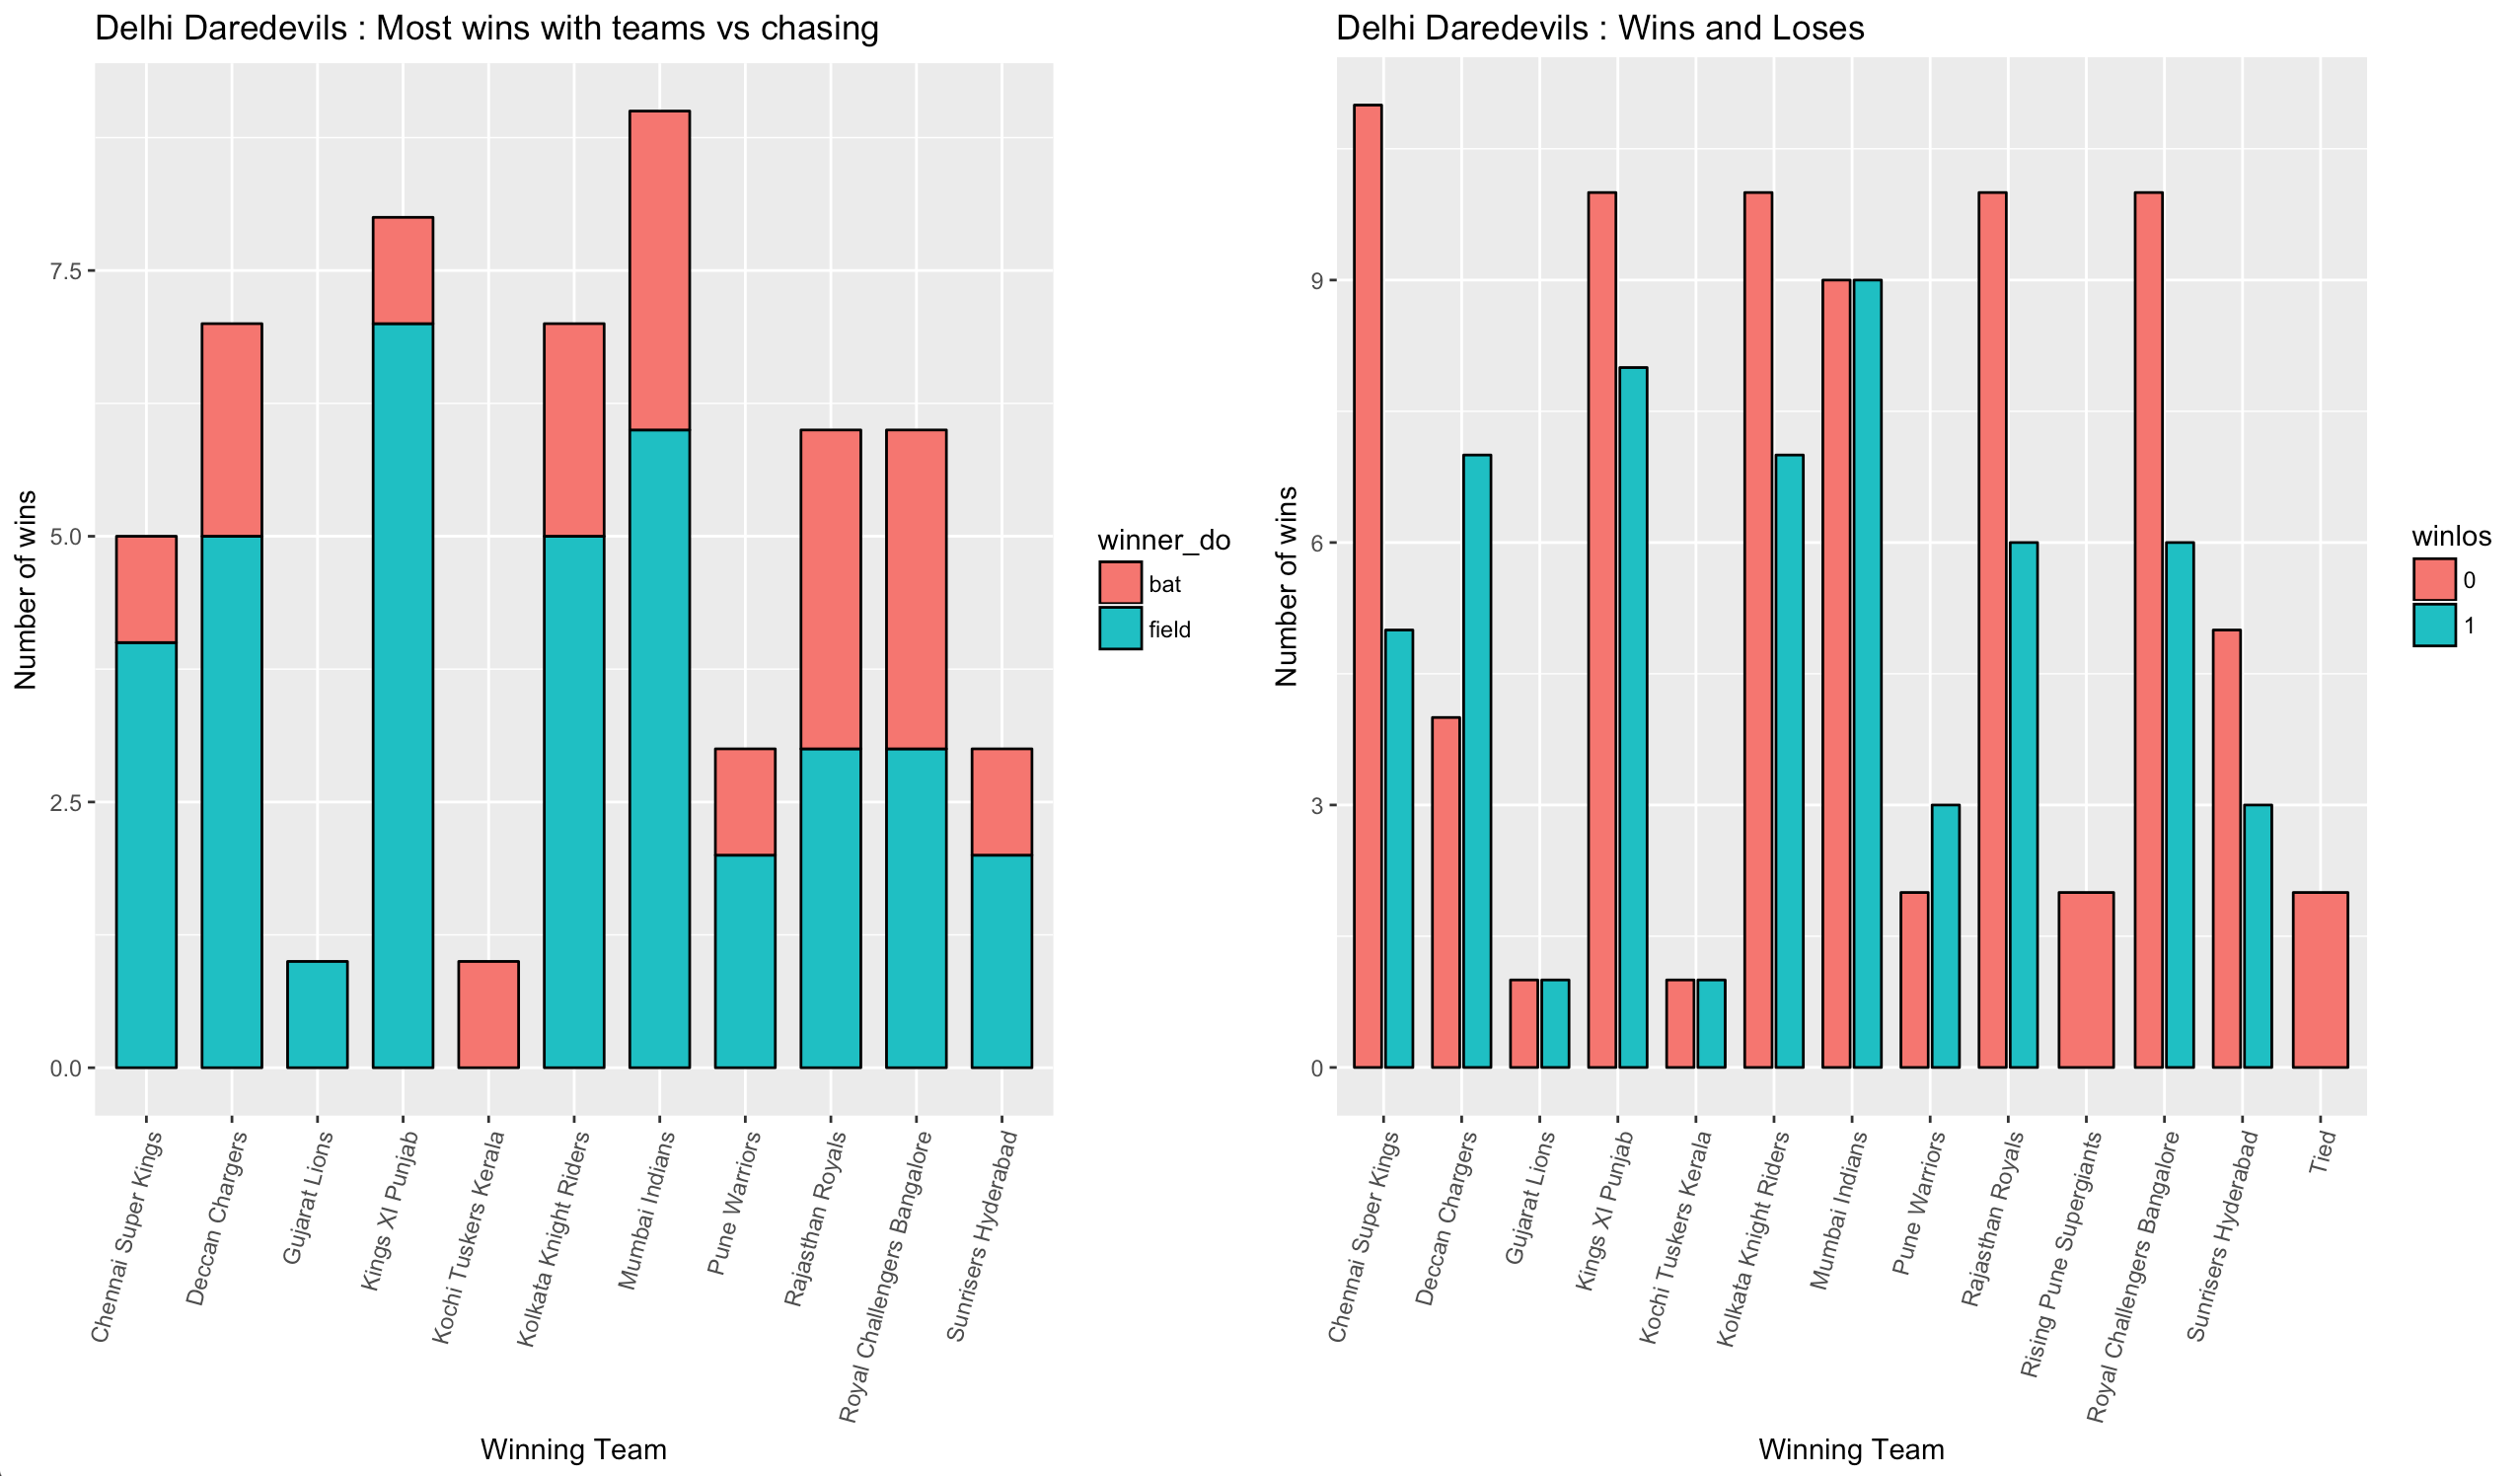
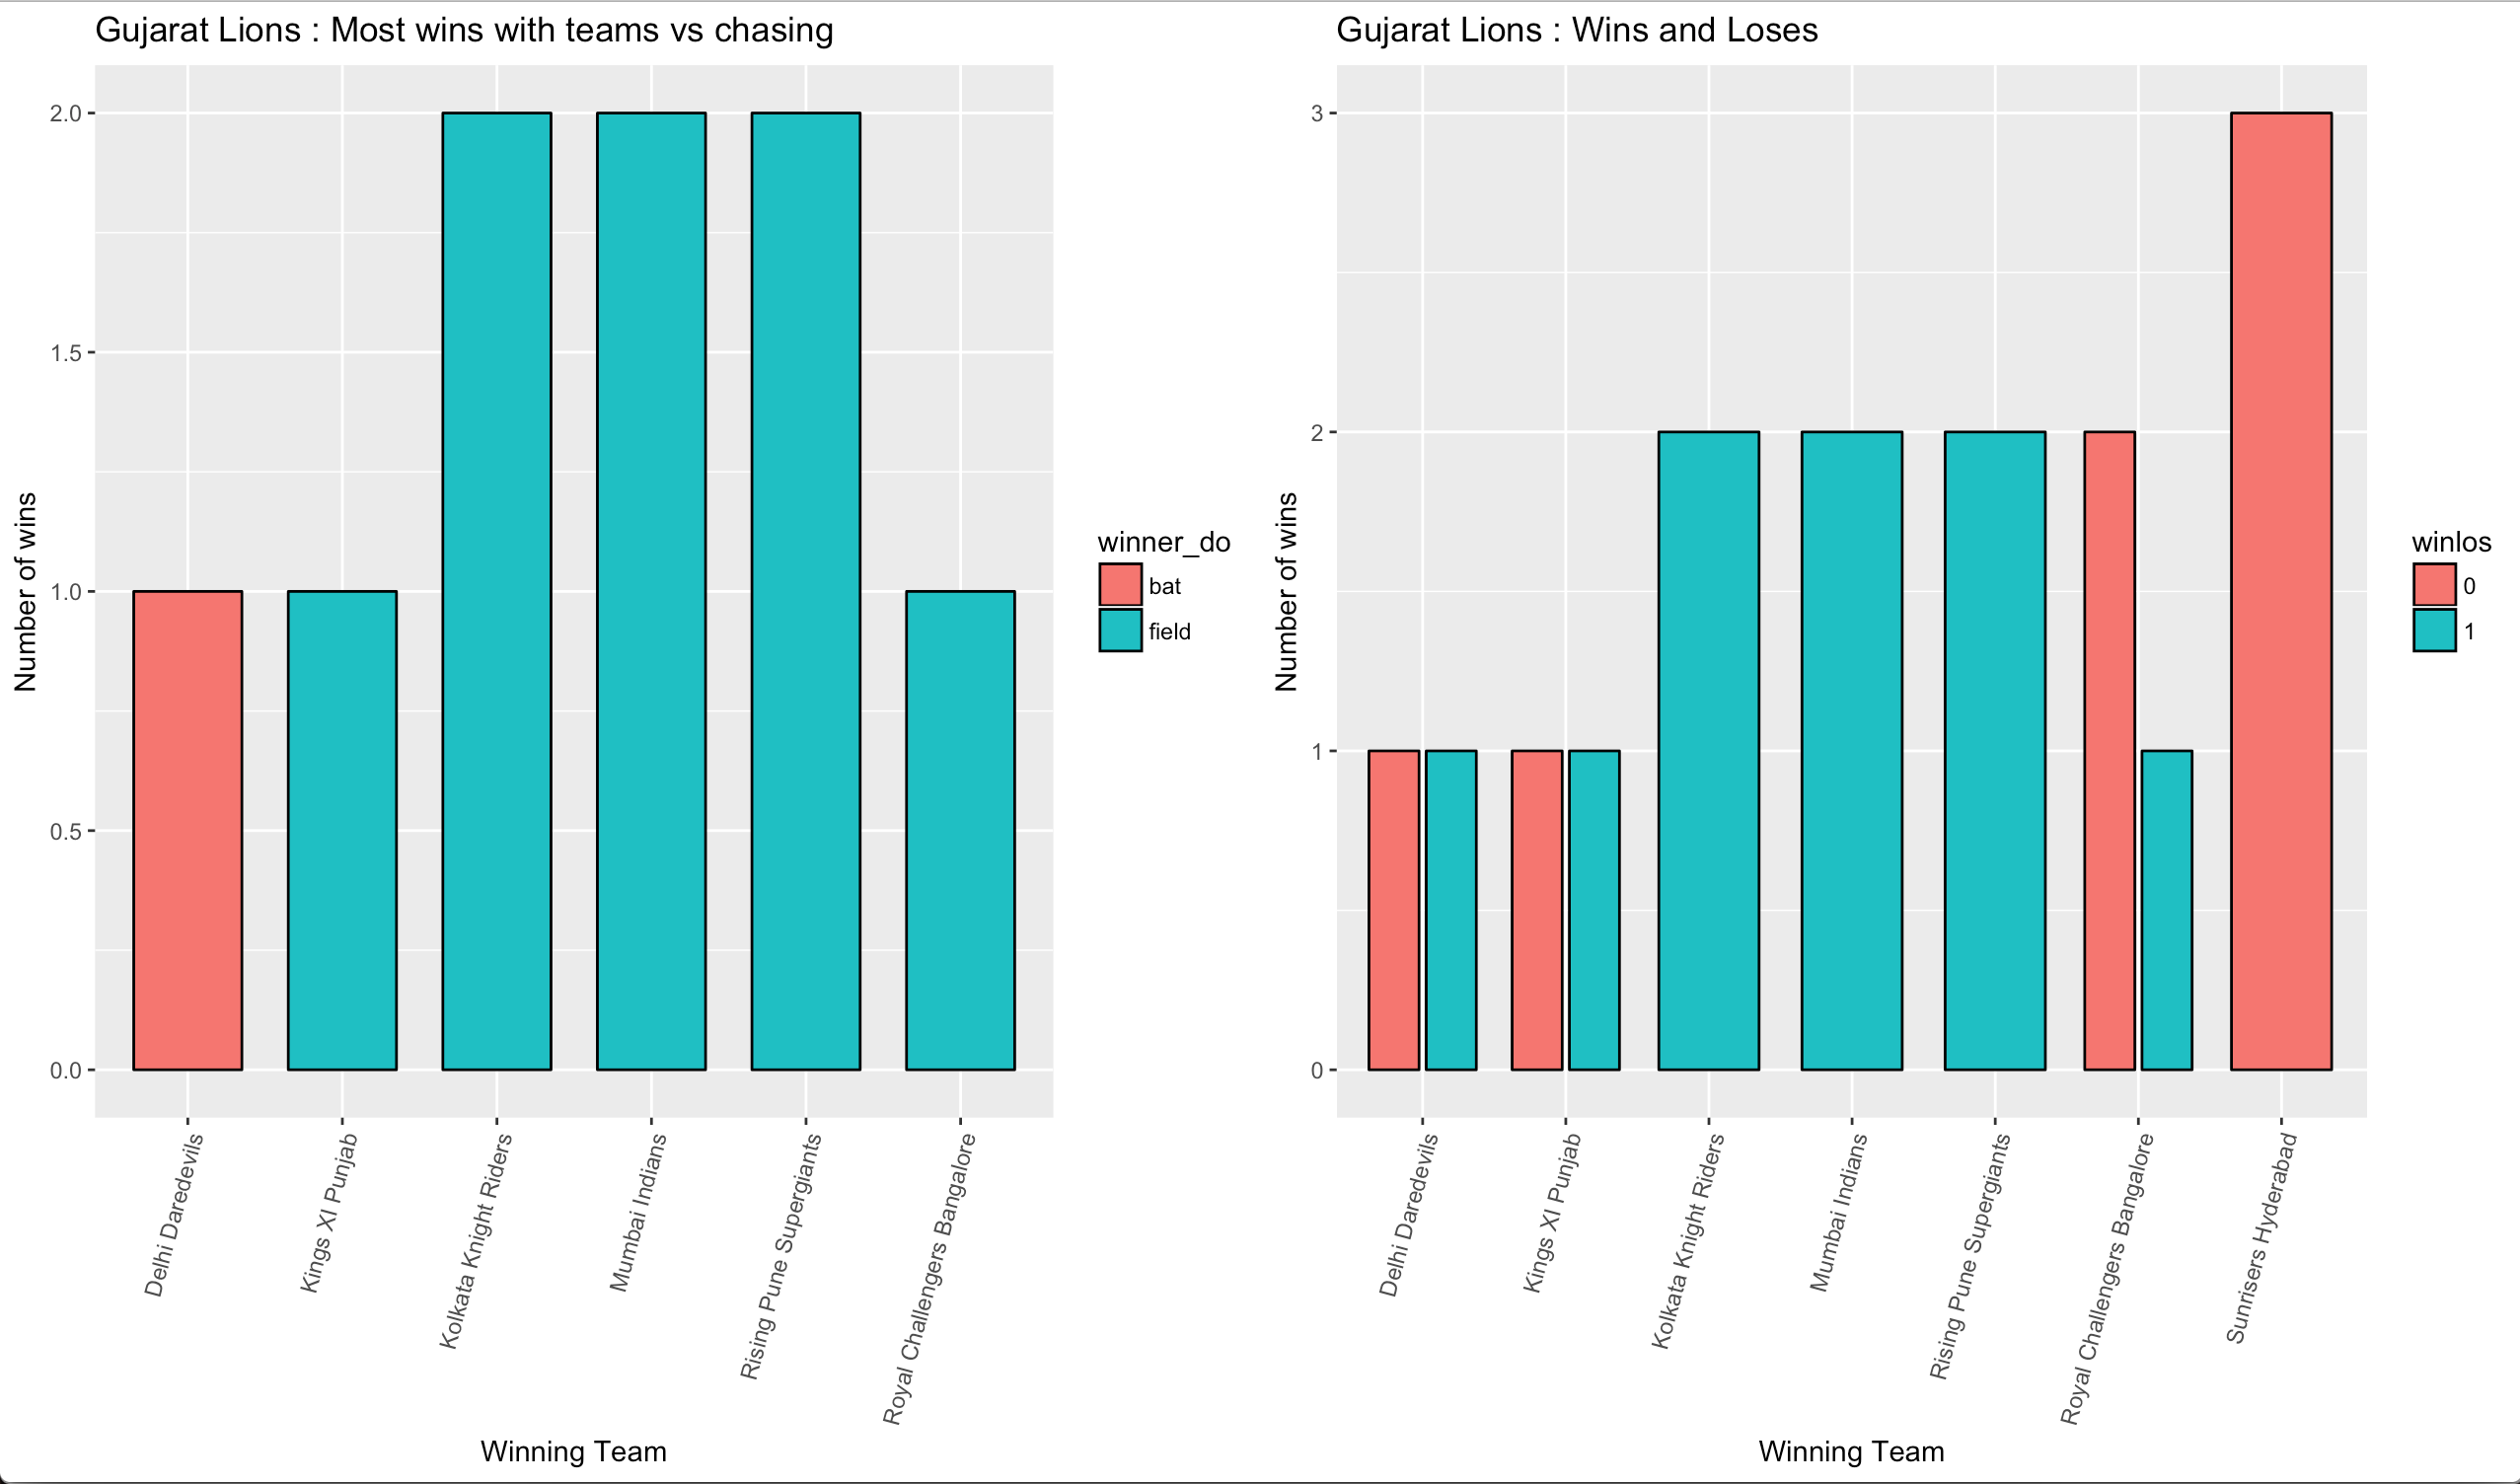
4. Teams who win close games
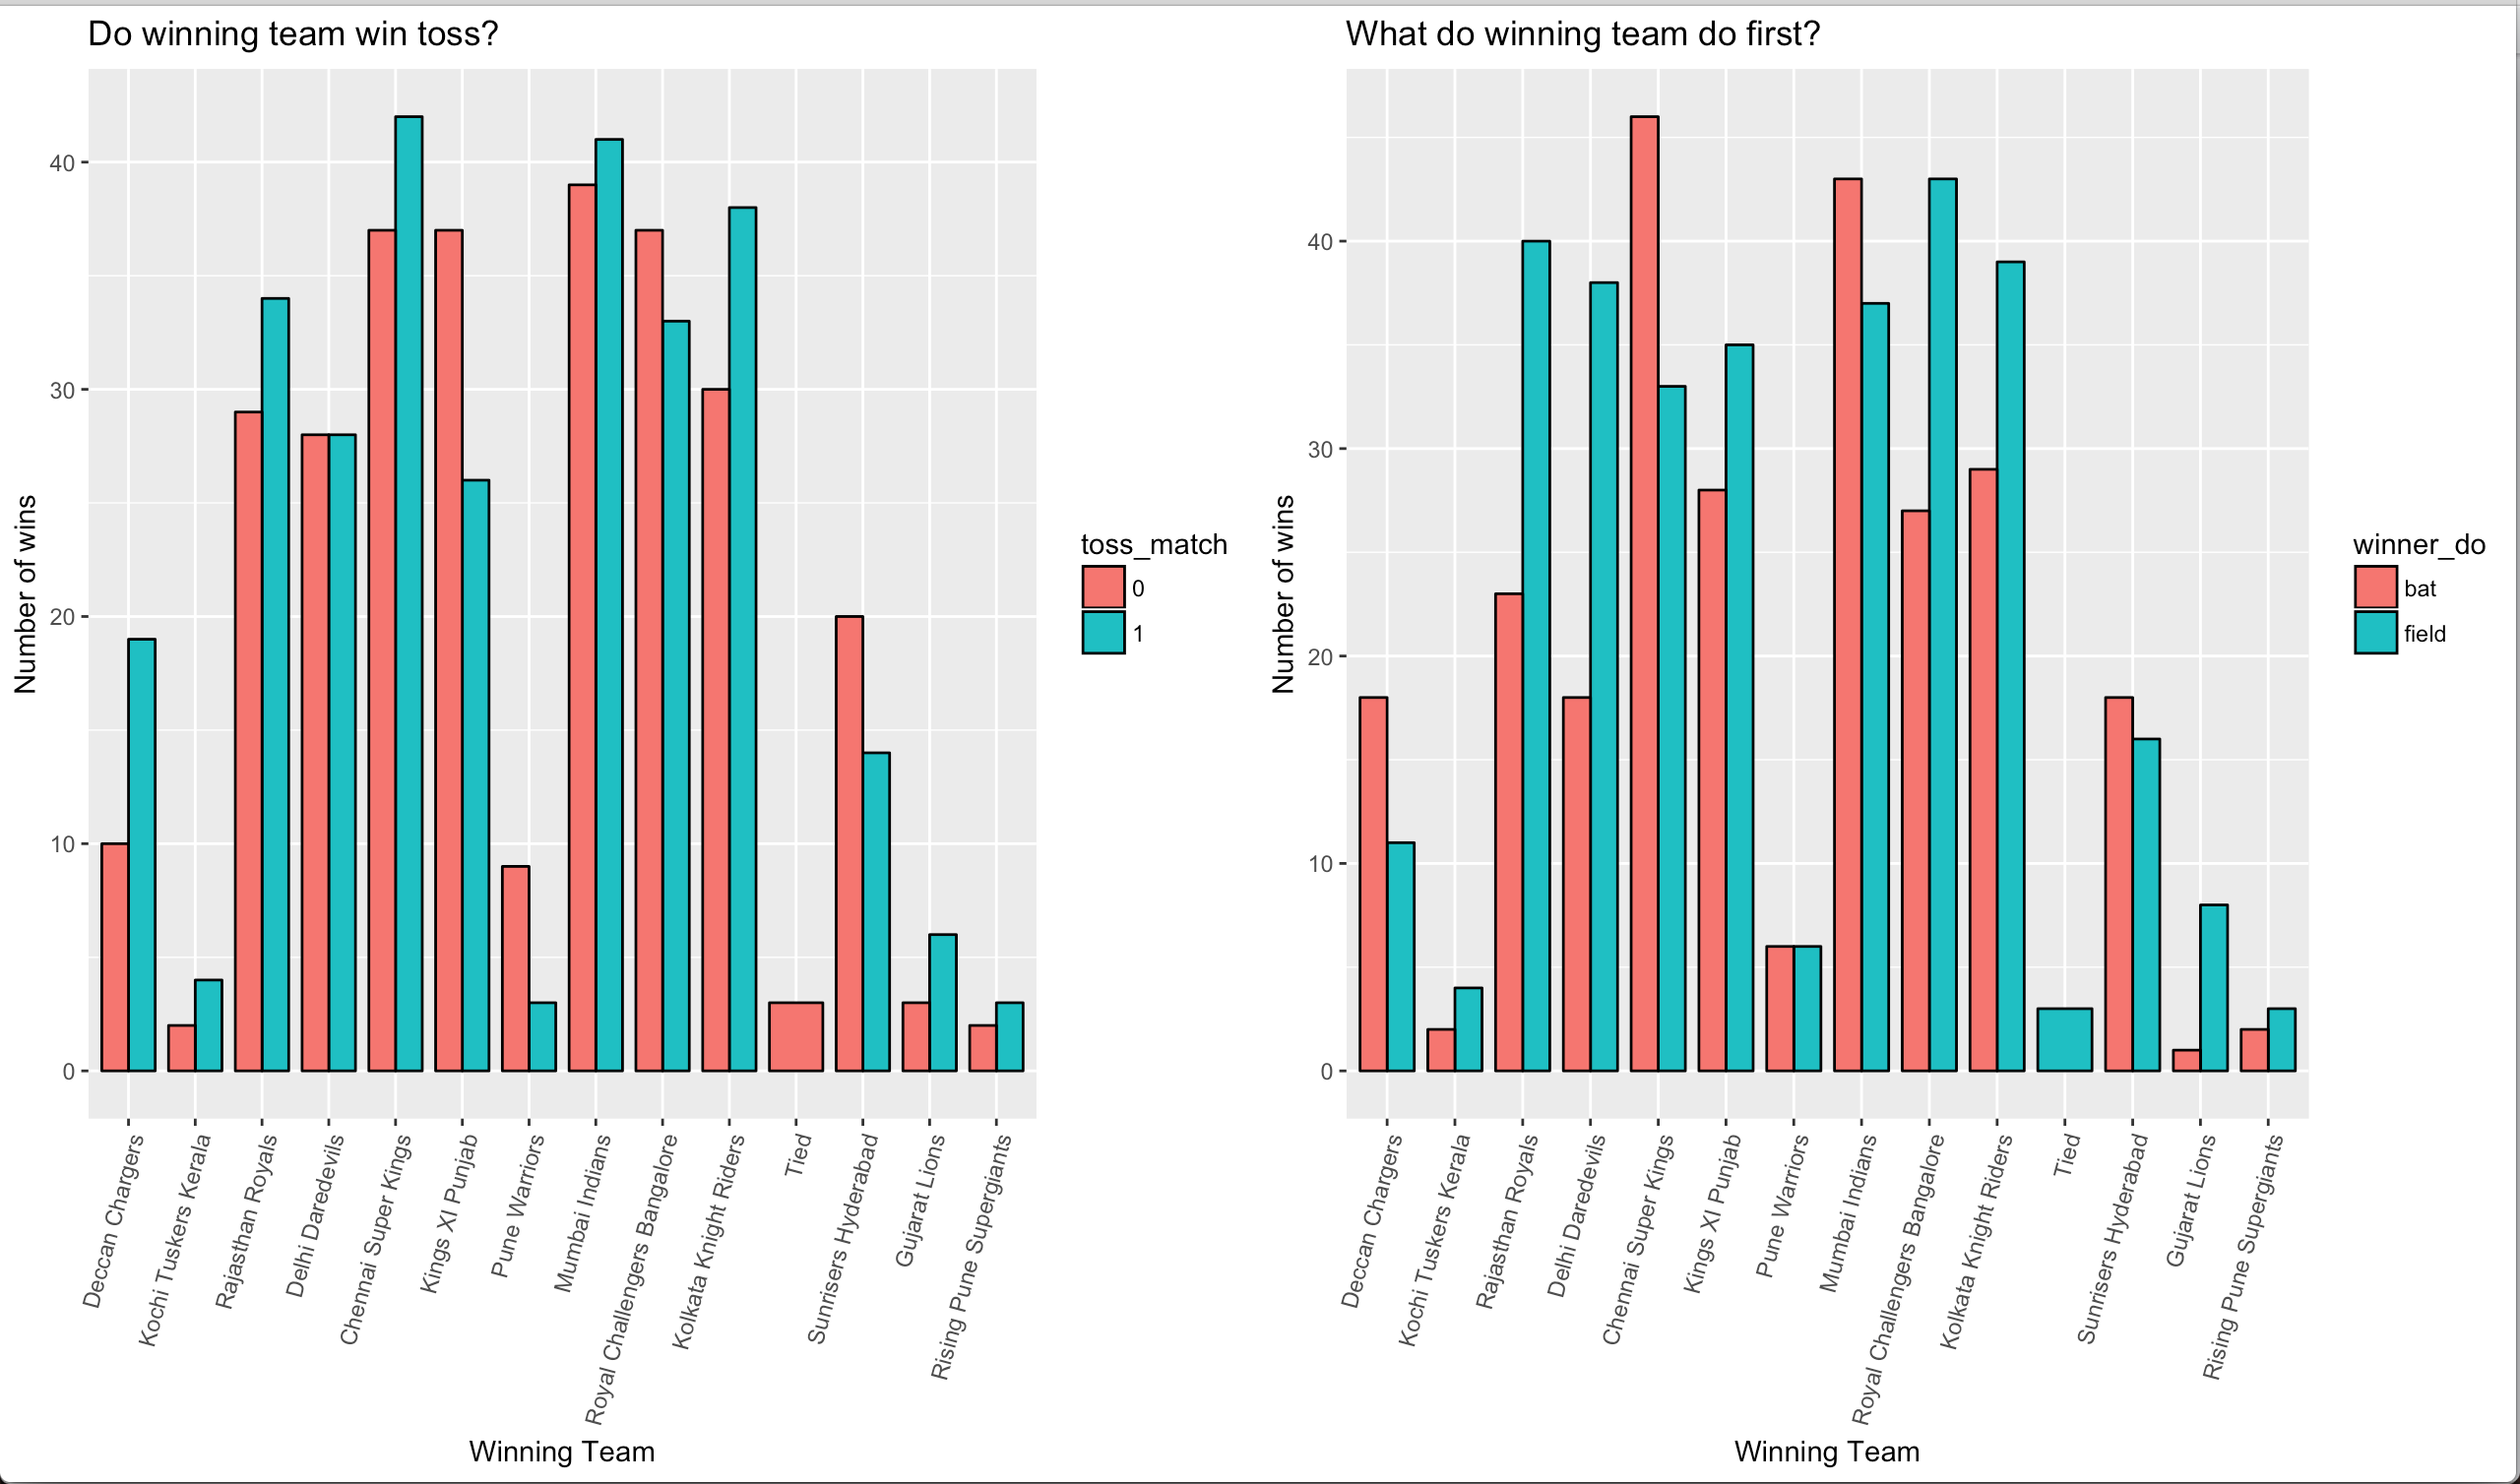
5. Which team wins, winning the toss and batting first
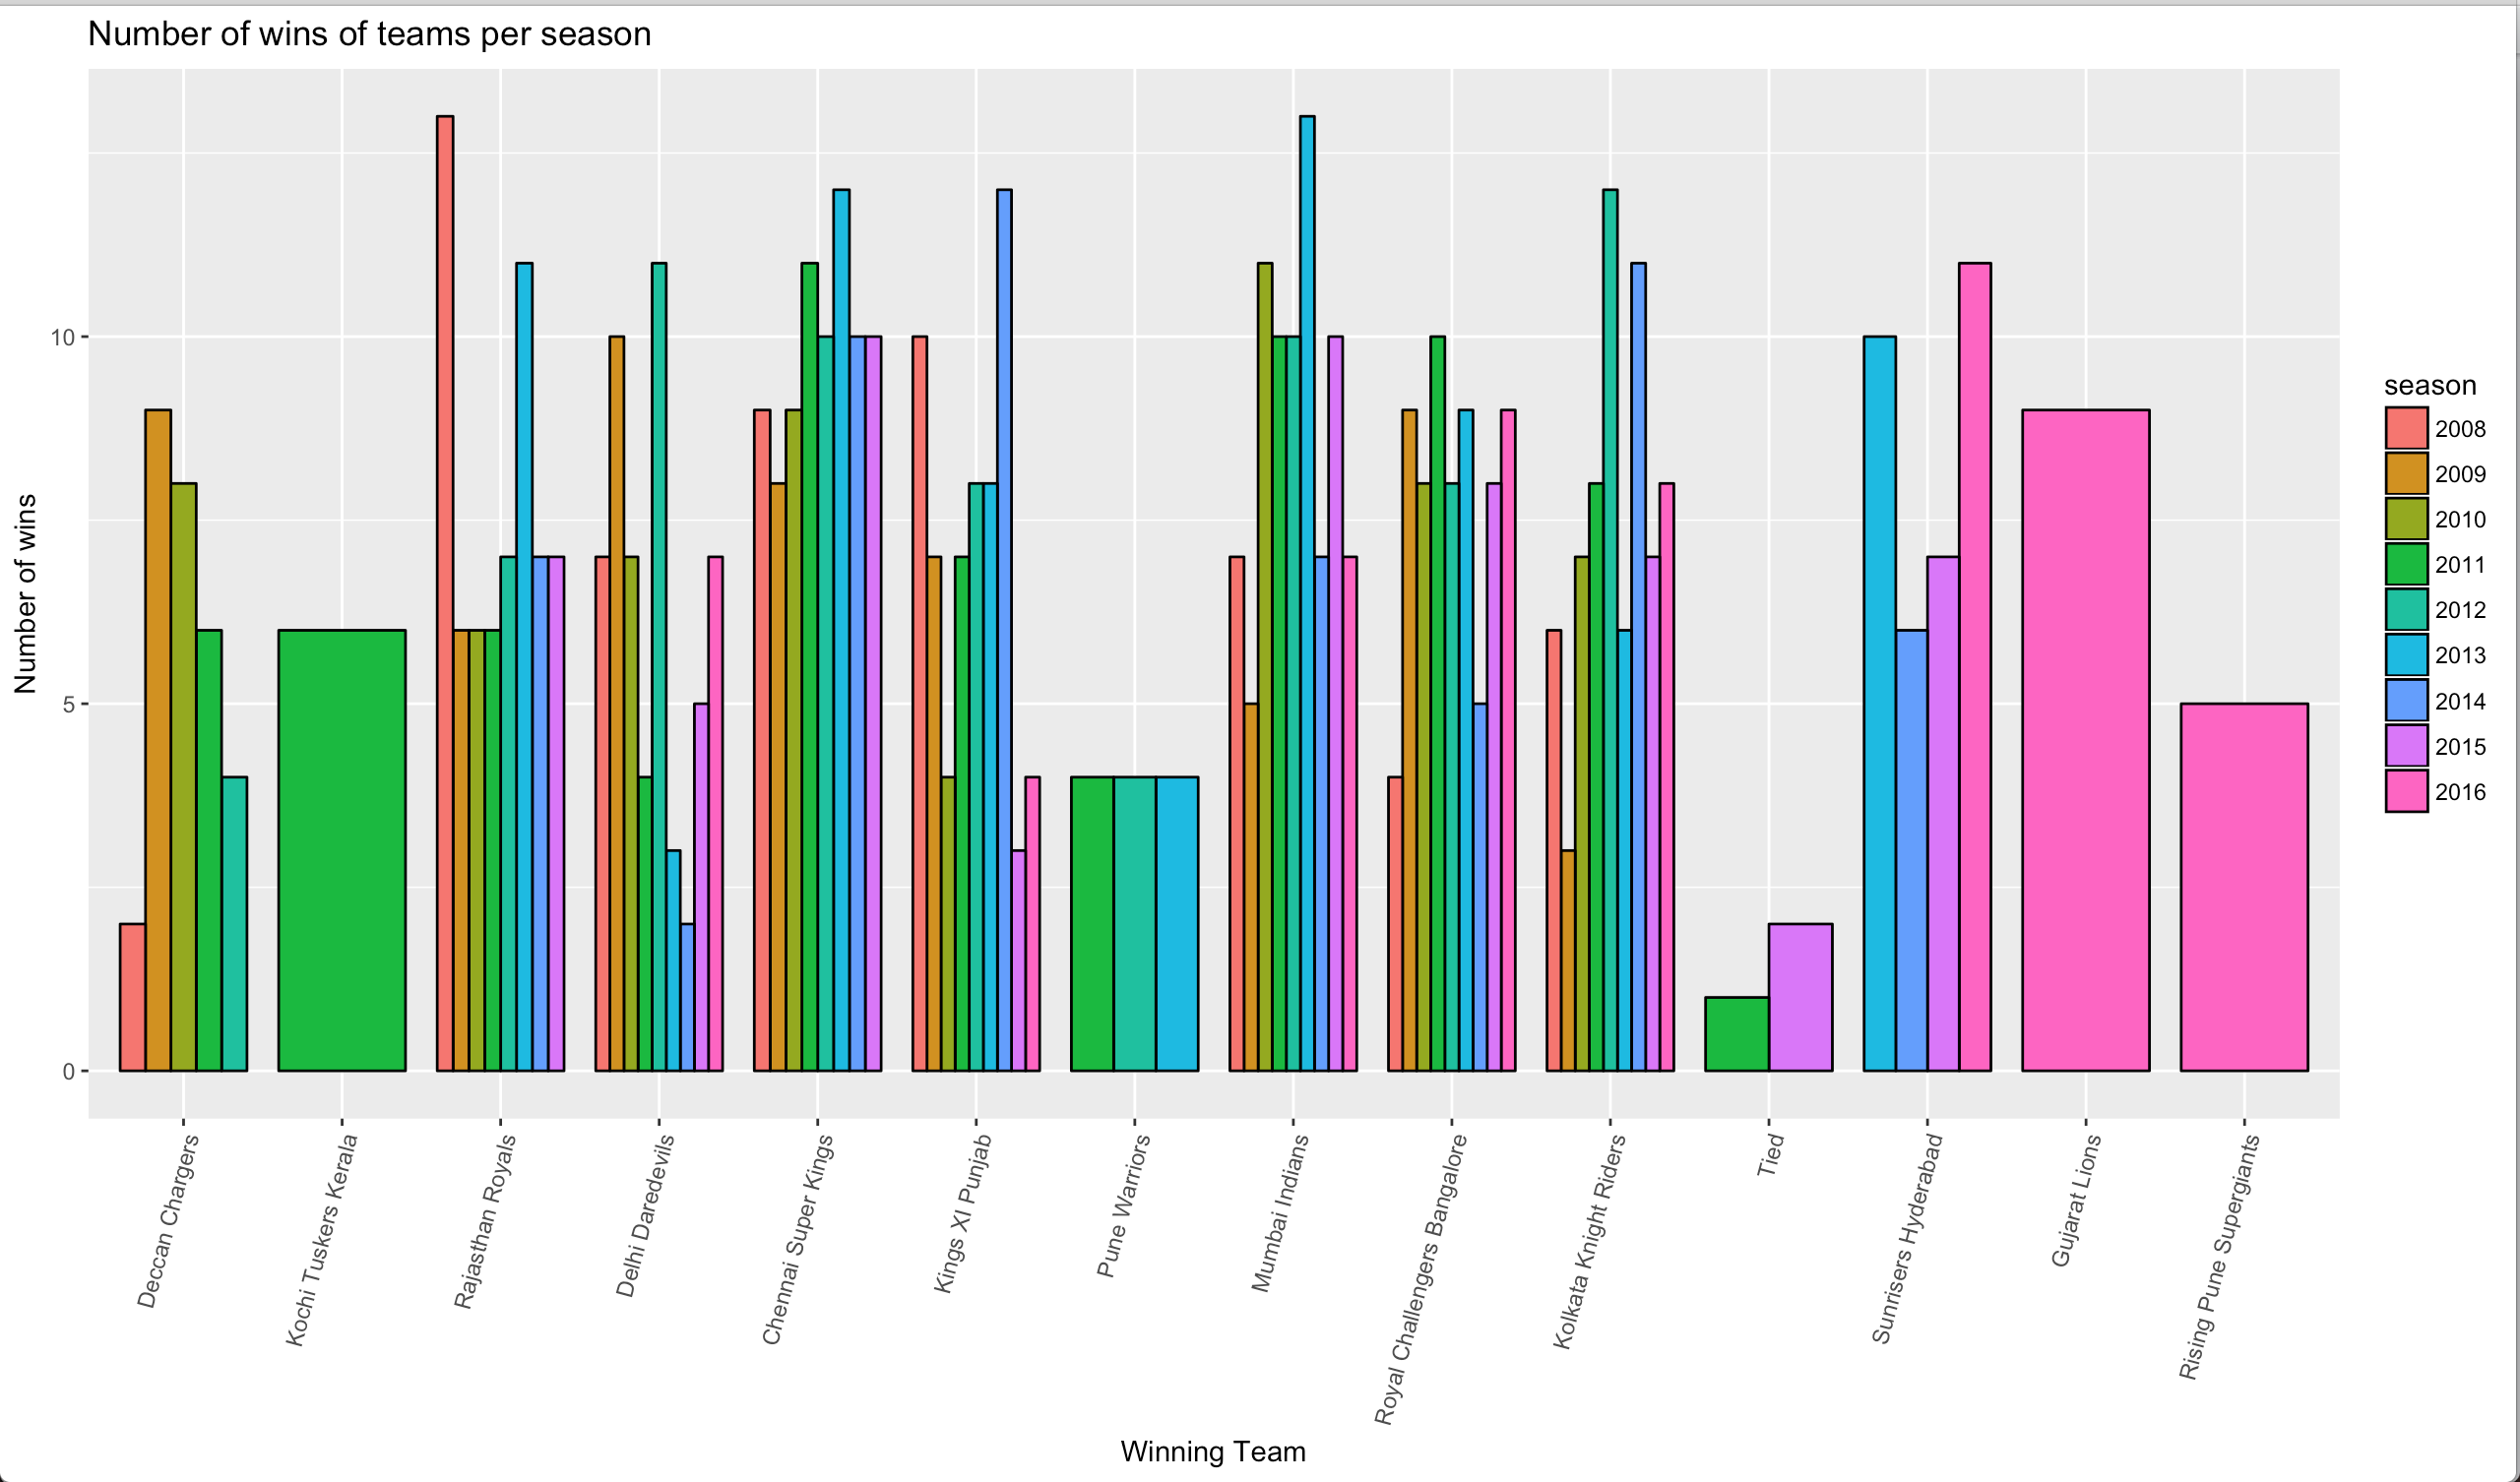
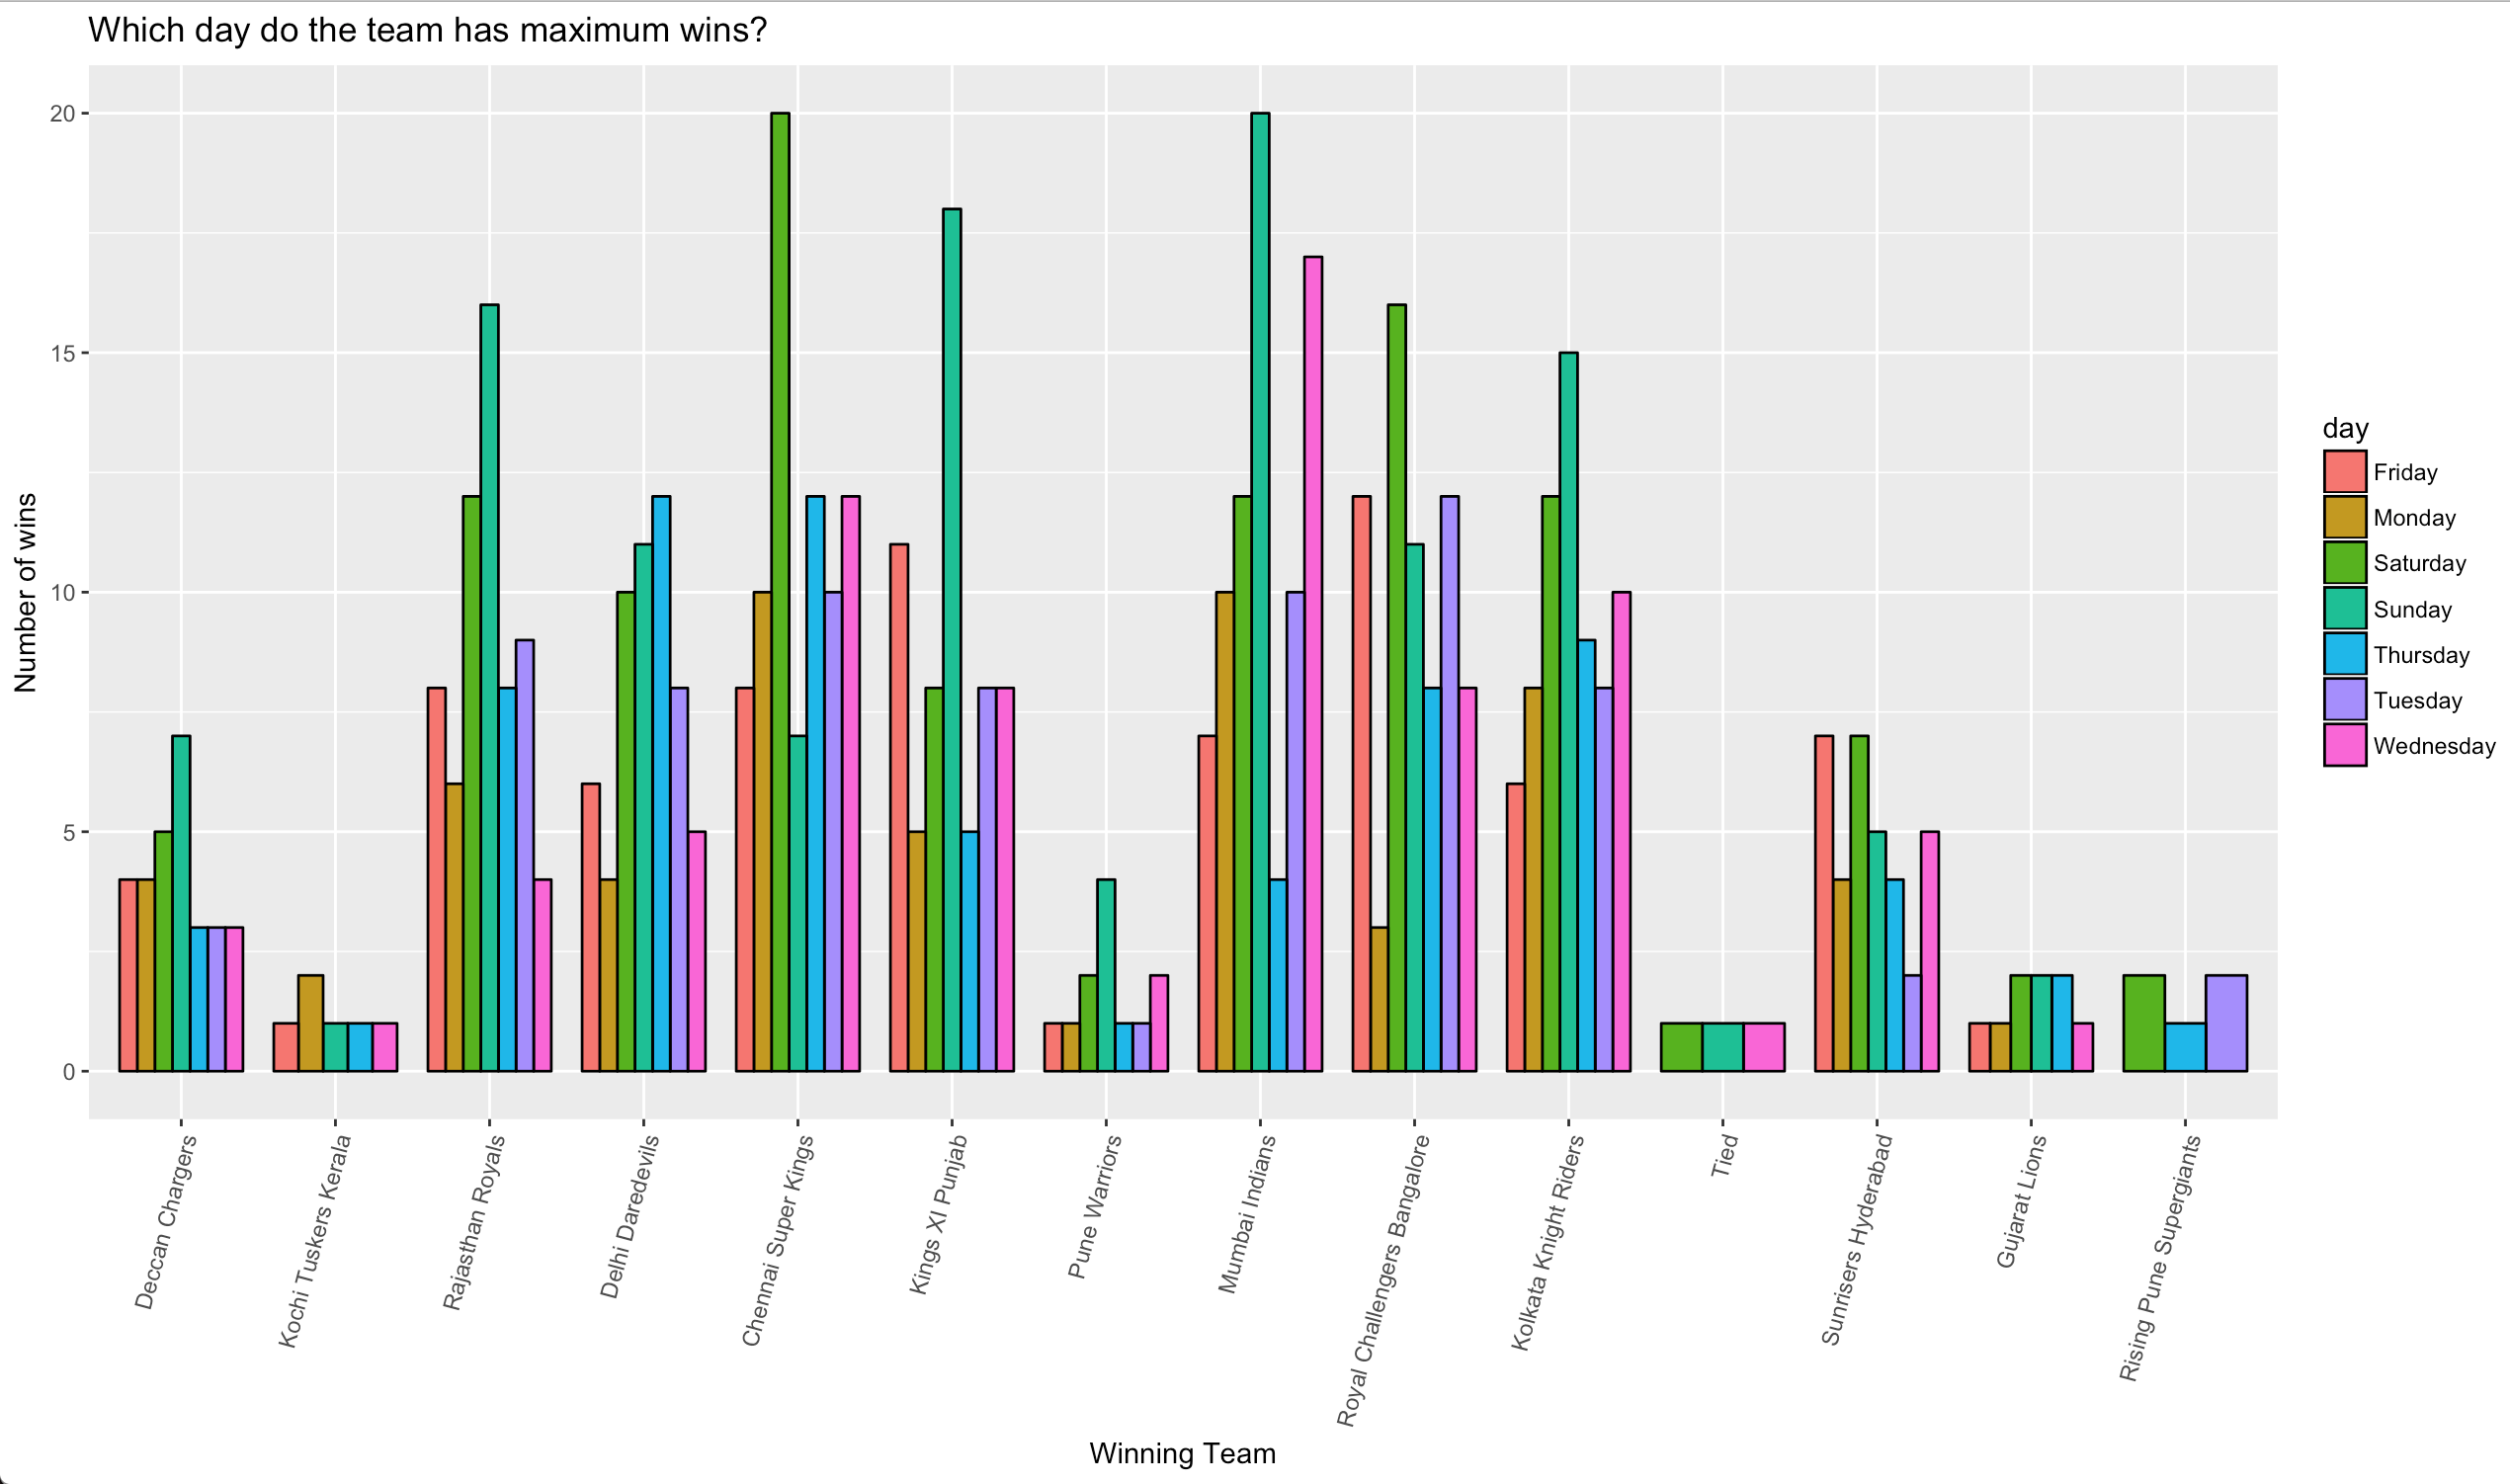
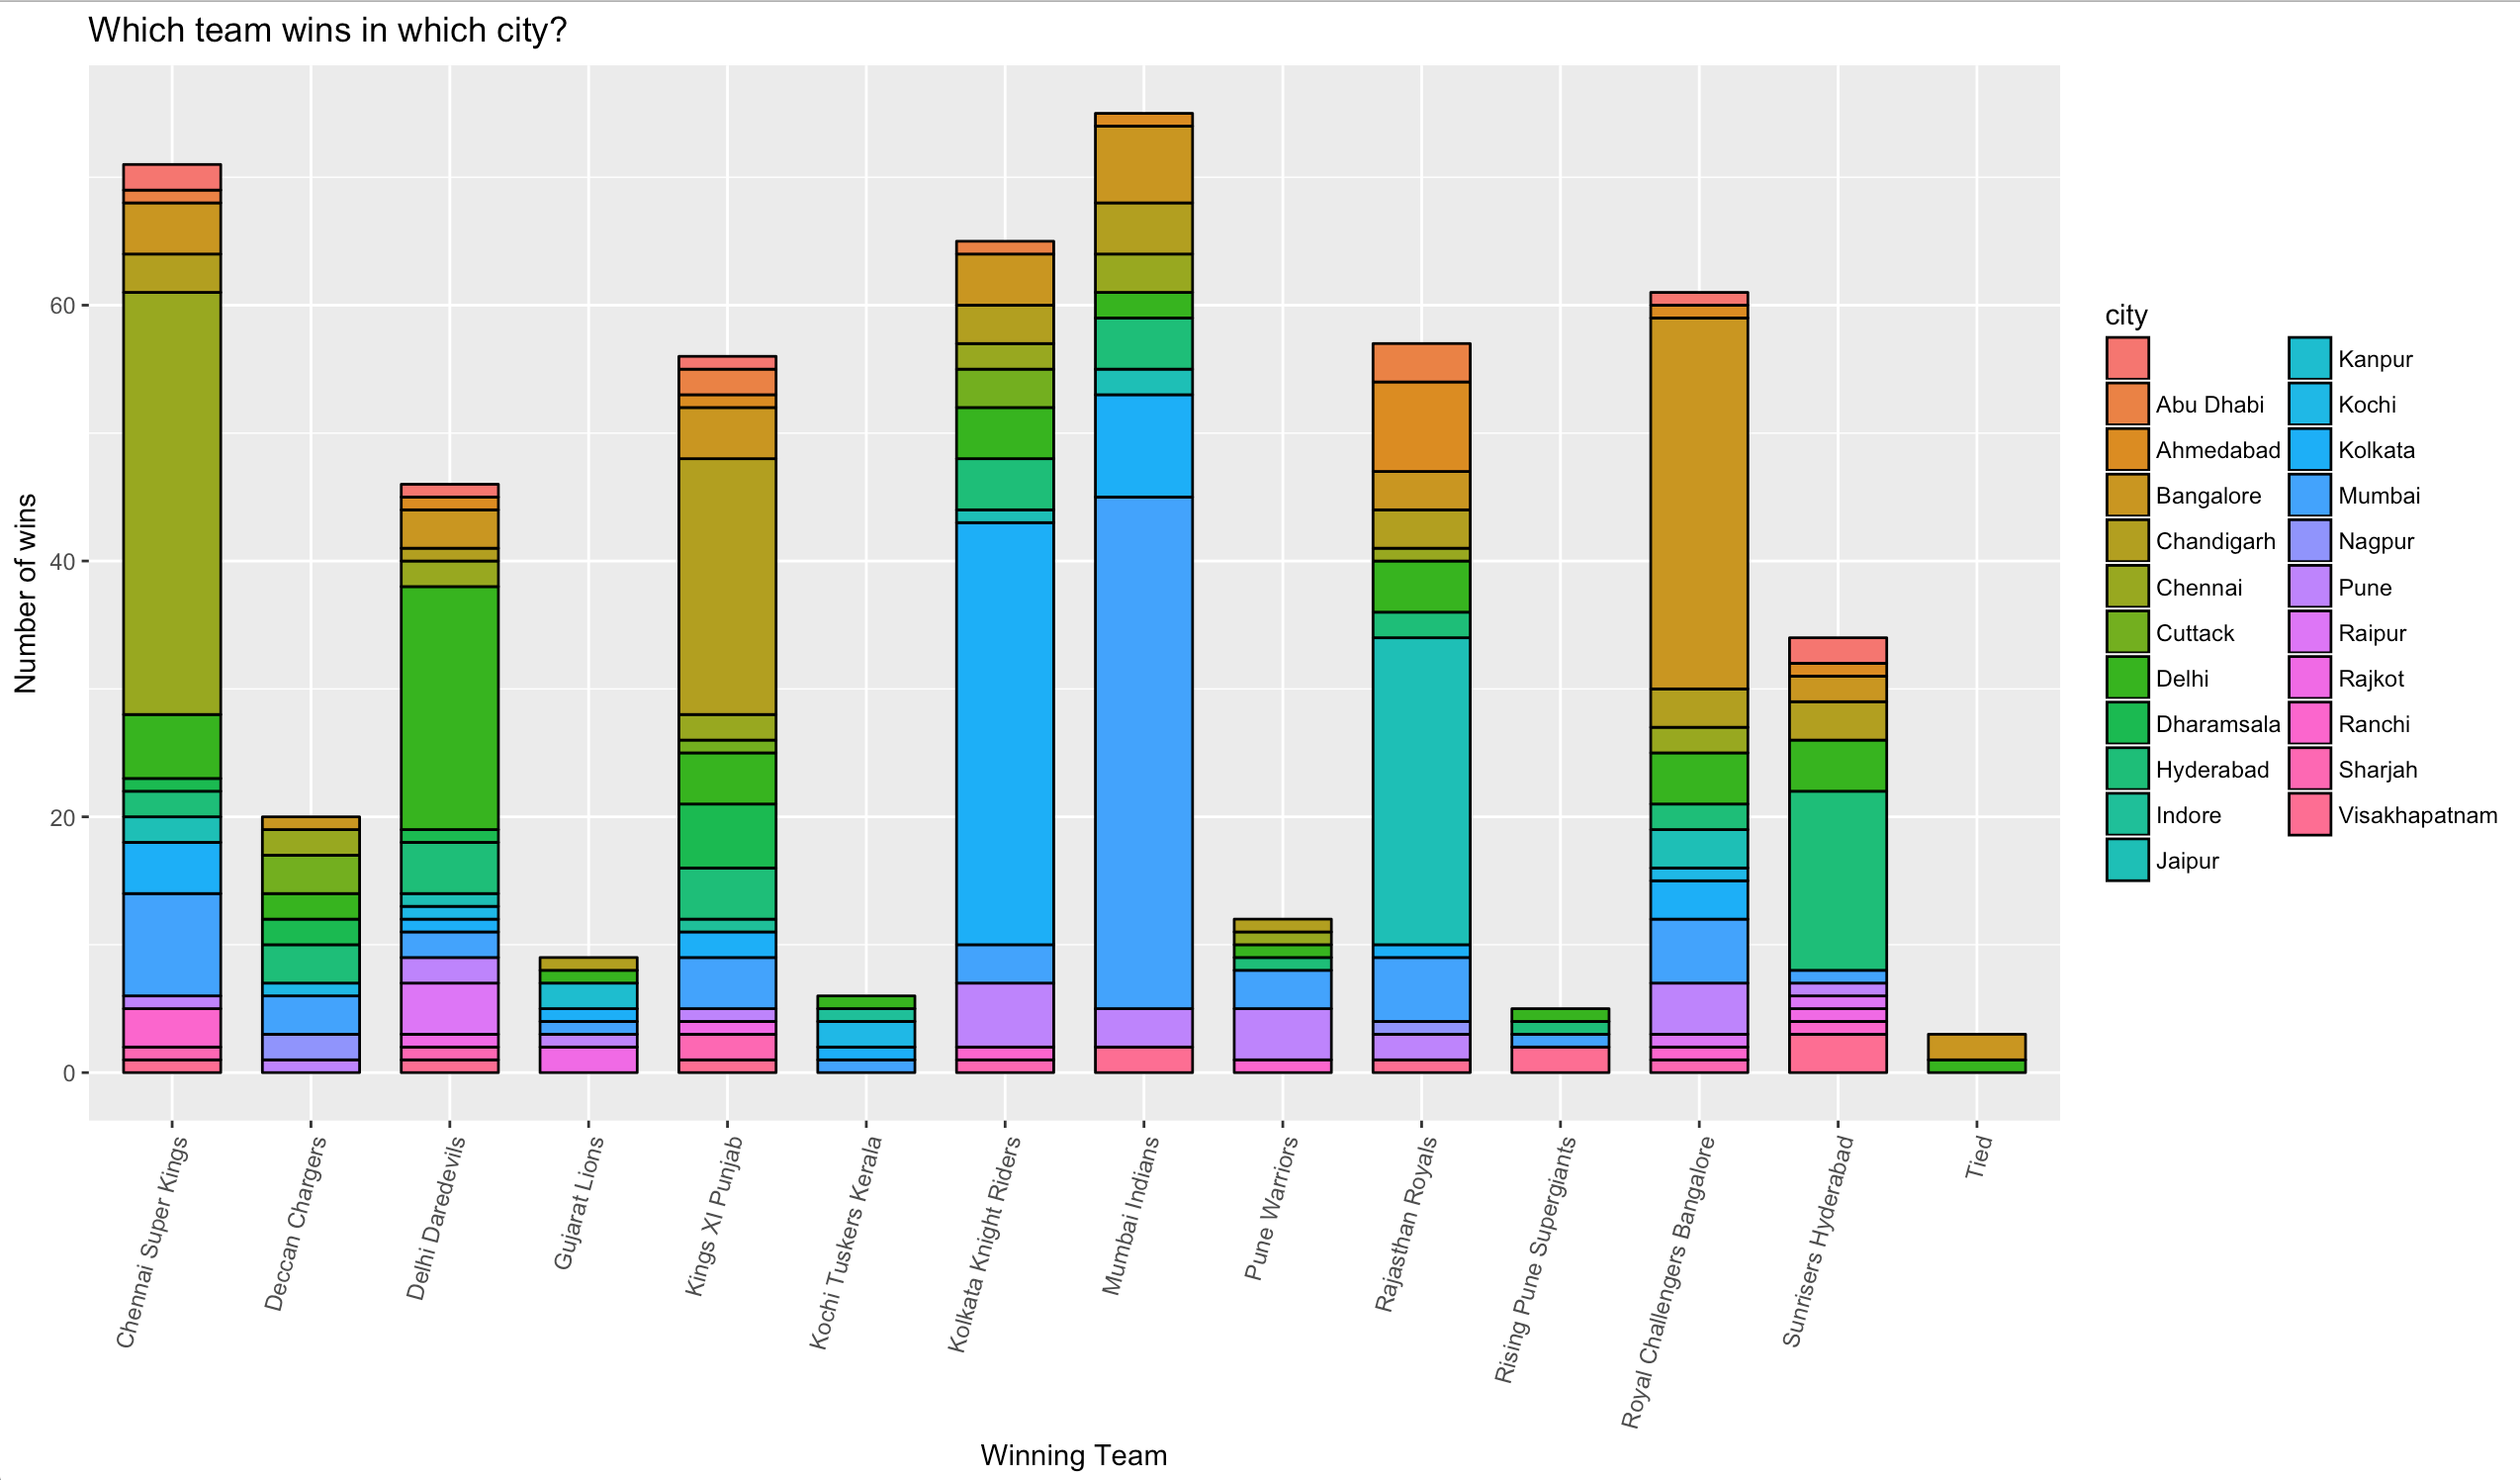
6. Day wise, City wise and season wise win of the teams
7. Each team’s total wins and losses
Interesting facts:
Here are a few facts I found interesting, which I could observe at the first look.
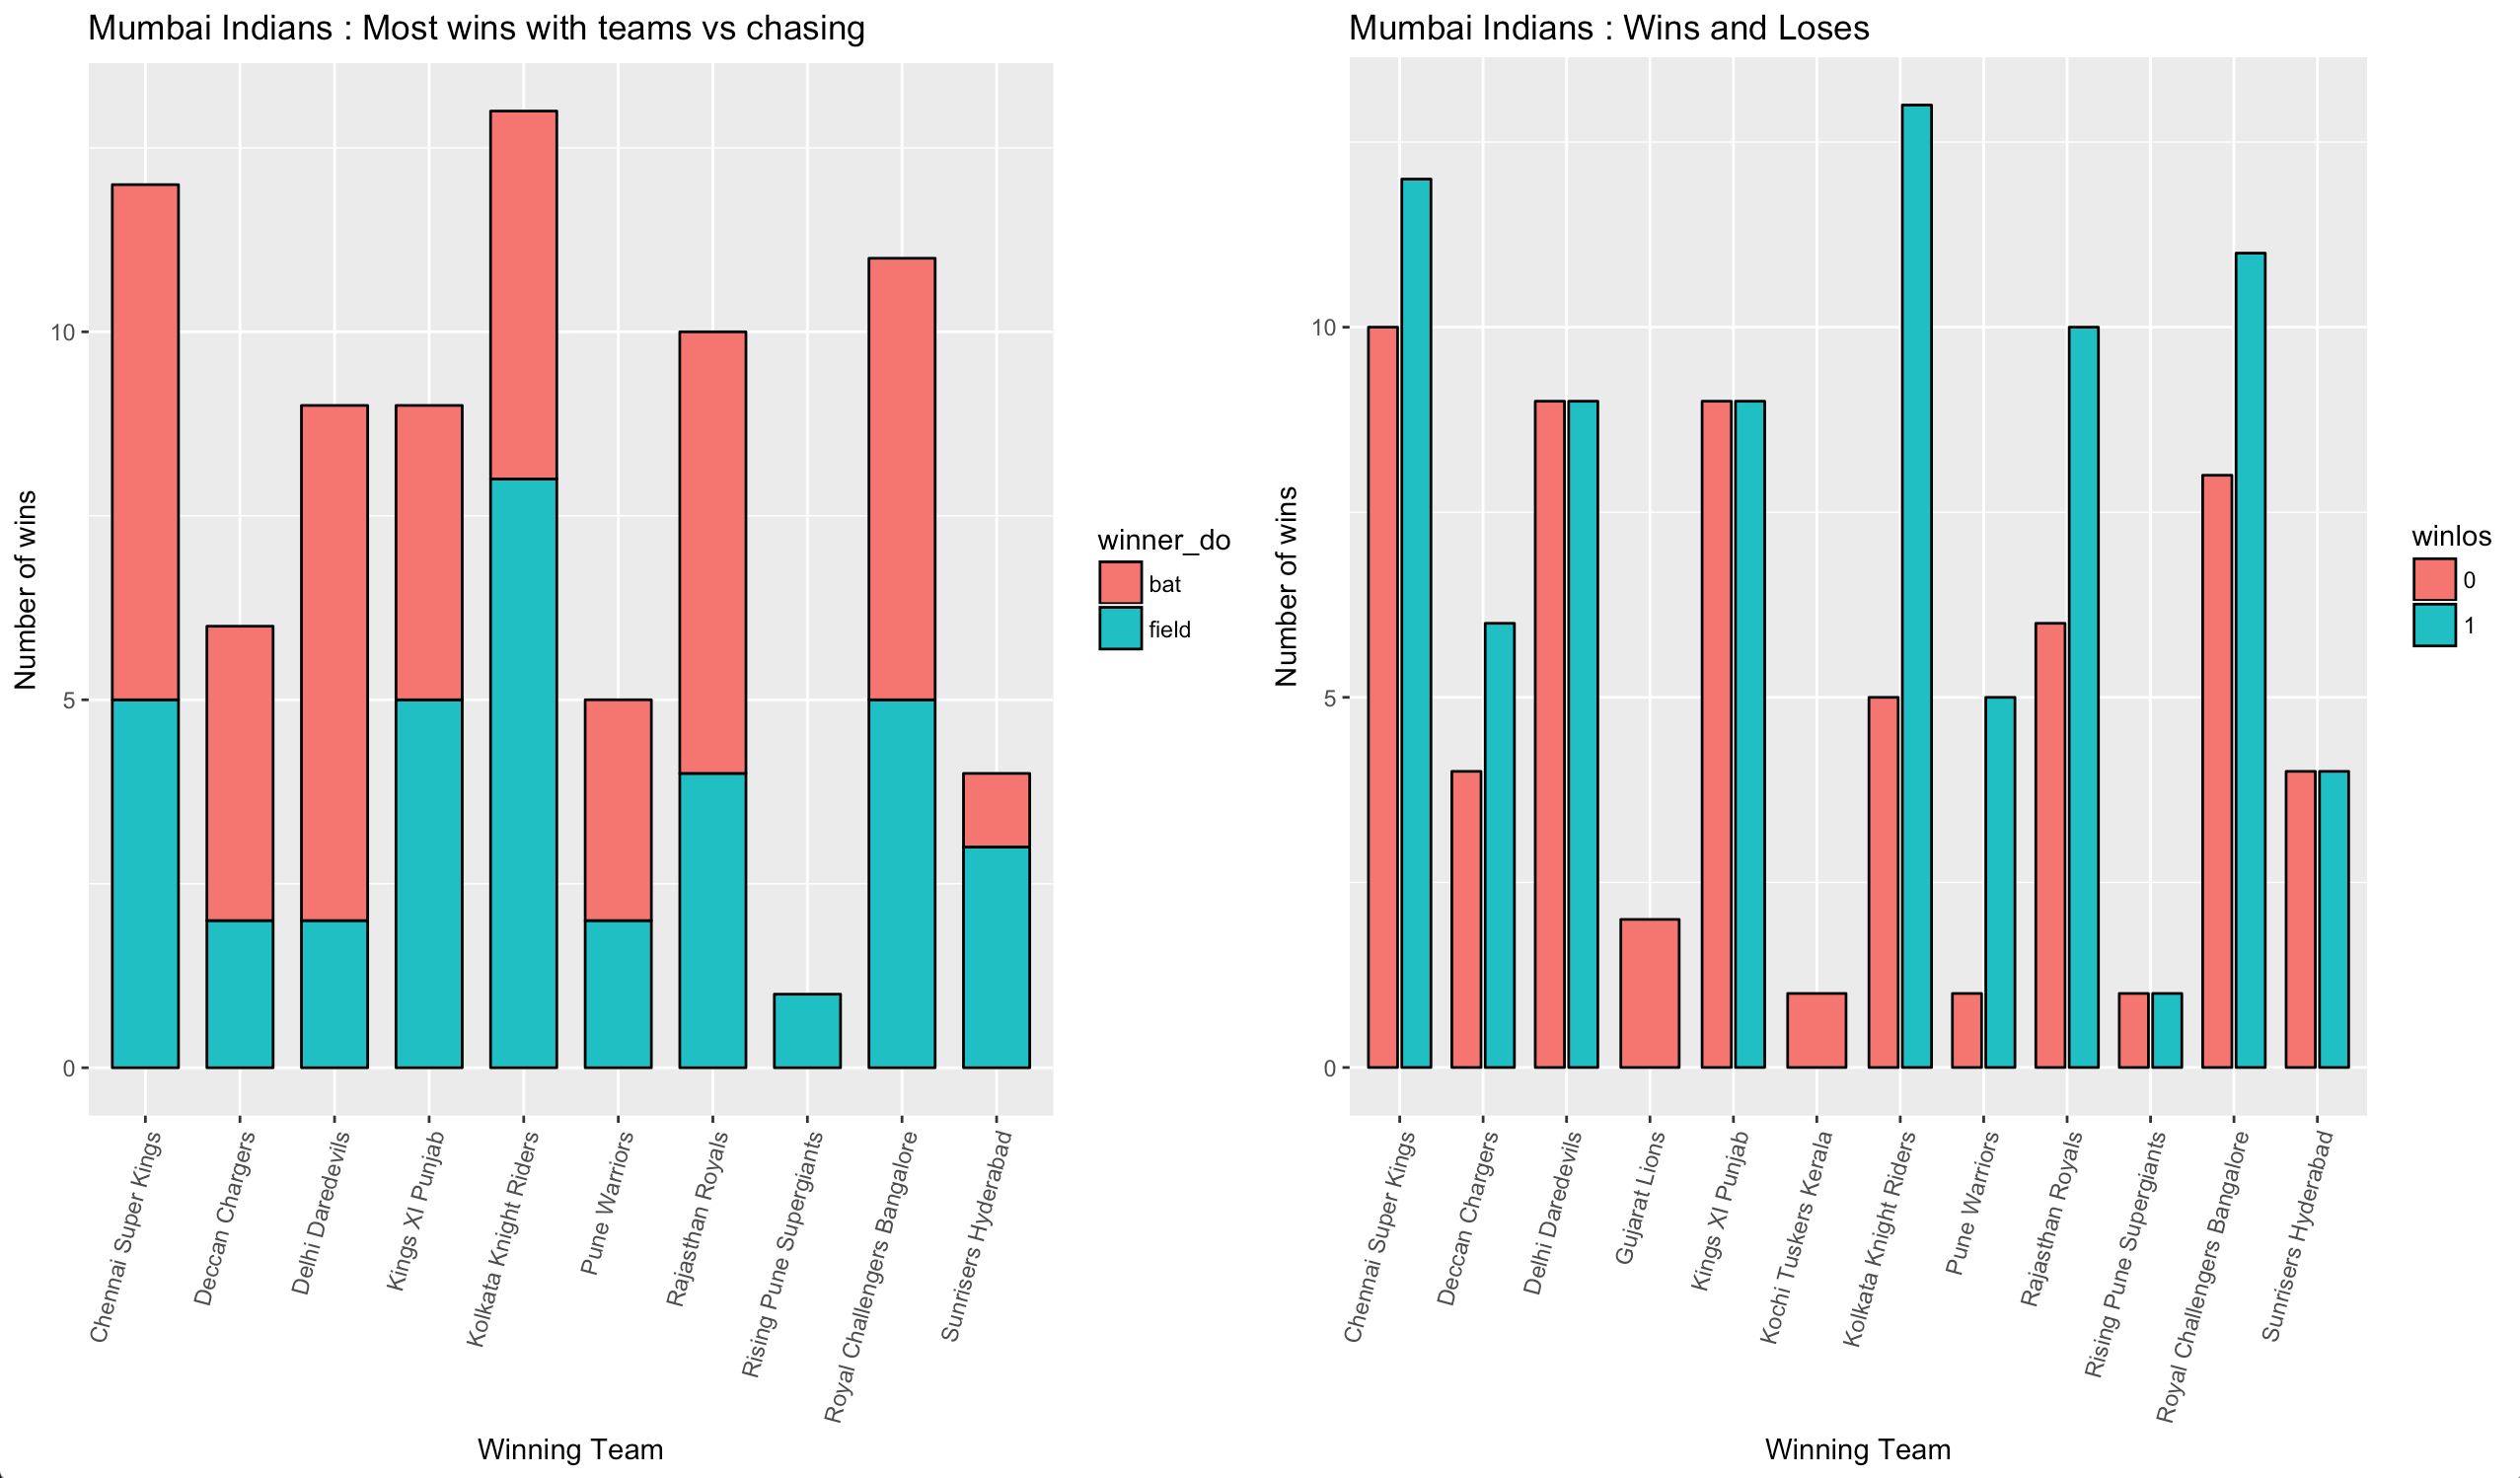
- Wednesday’s are lucky for Mumbai Indians. (Similar to Friday + Pakistan)
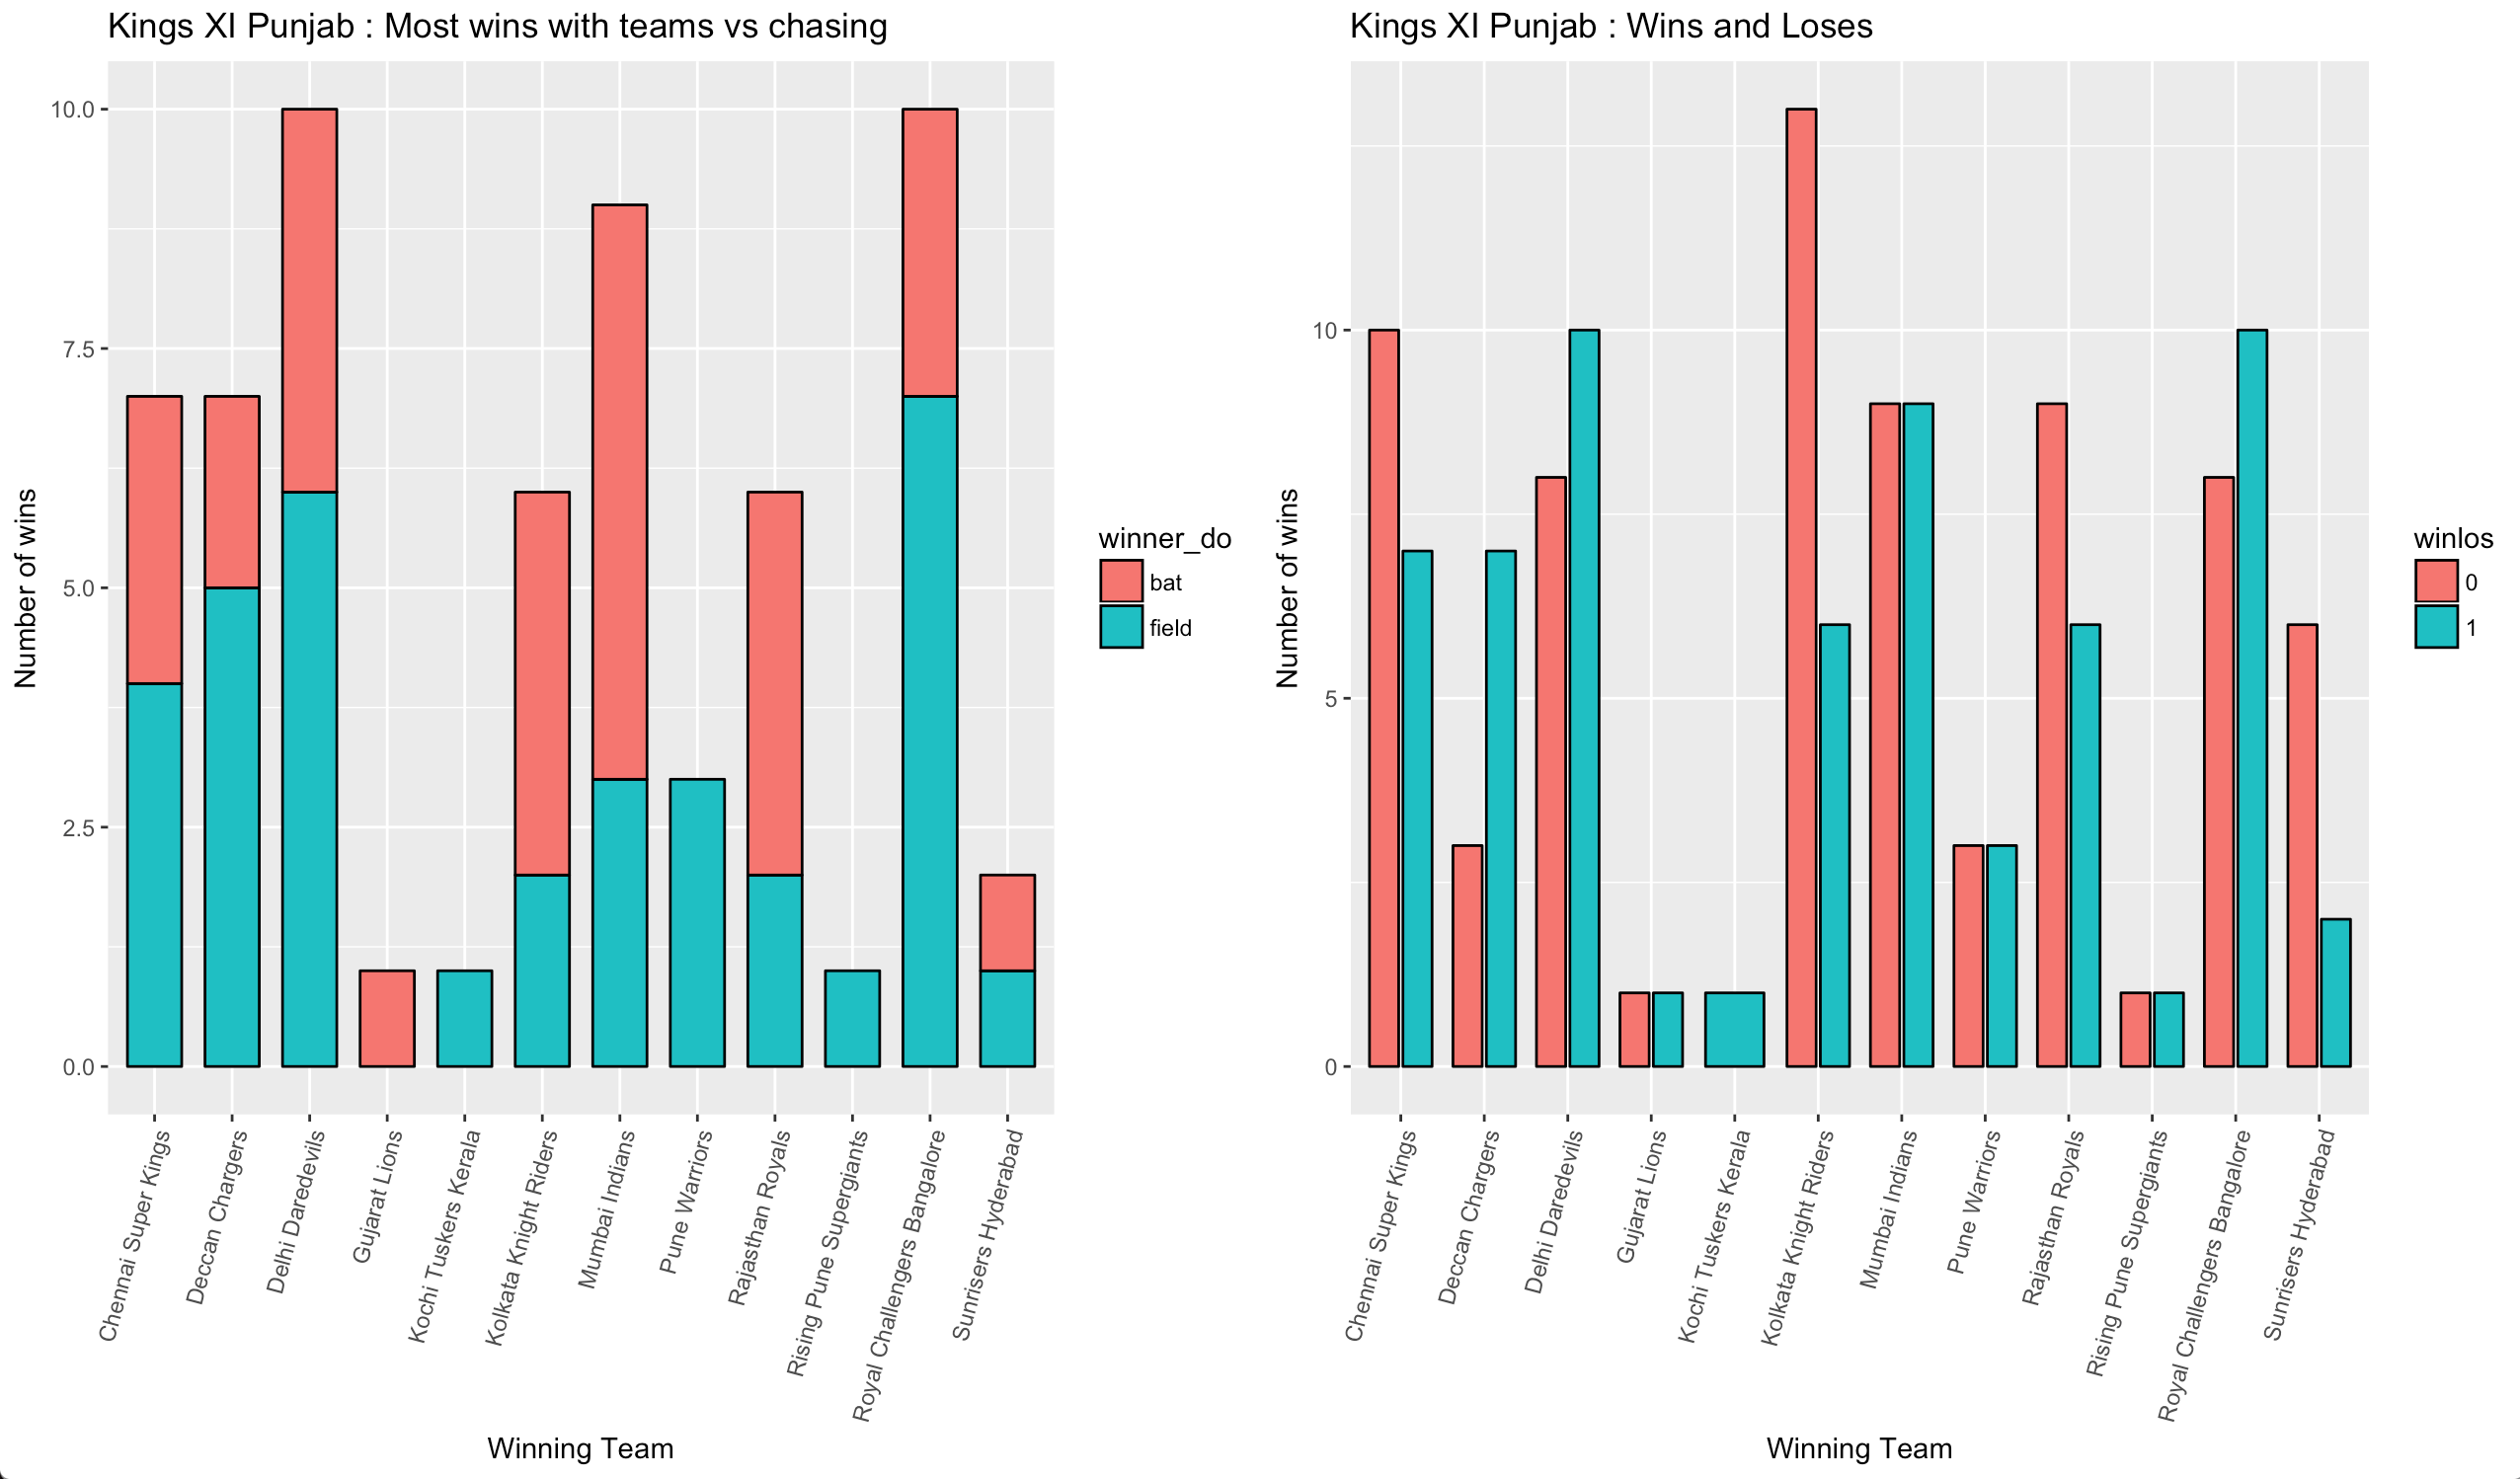
- King’s XI Punbaj and Mumbai Indians handle pressure and win the nail-biting finishes
- There are a high number of boundaries in the first 6 overs (powerplay), but the number of dot balls decreases linearly.
- Number of wickets lost is also high during the powerplay and increases drastically during the last overs for teams batting first while stays constant for teams batting second
- Team have a much higher probability of winning if they play in front of their home crowd
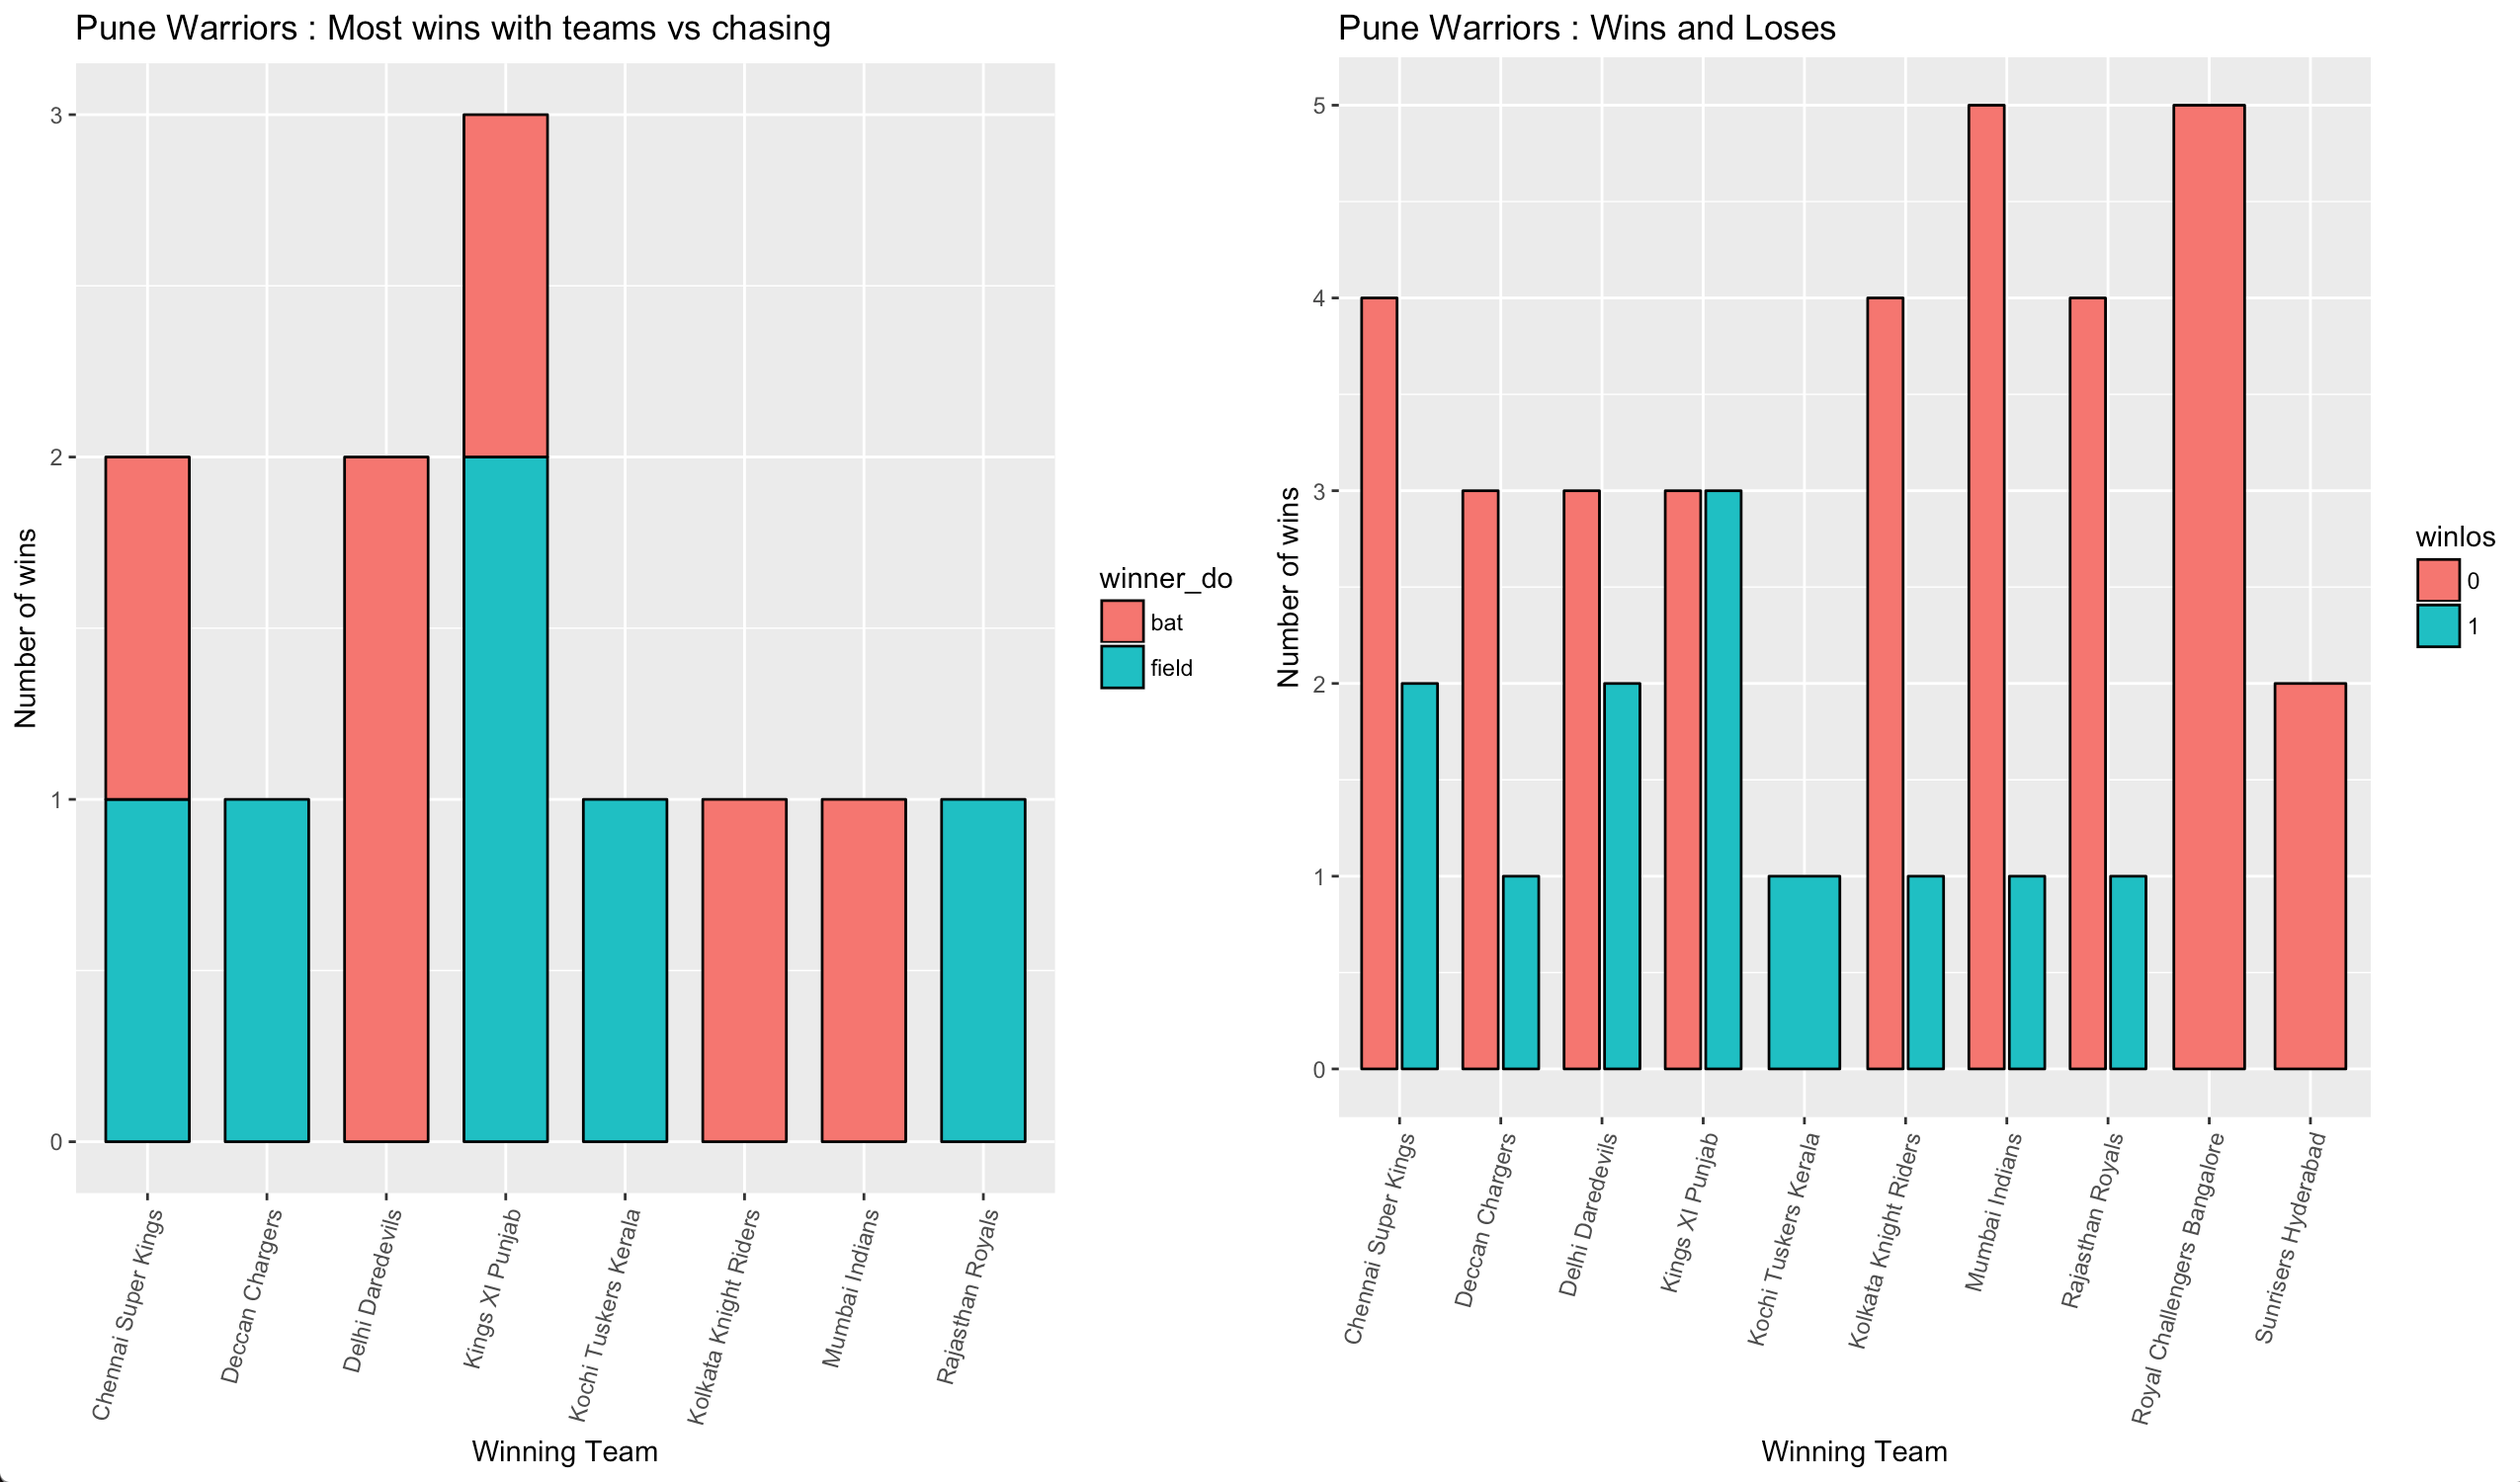
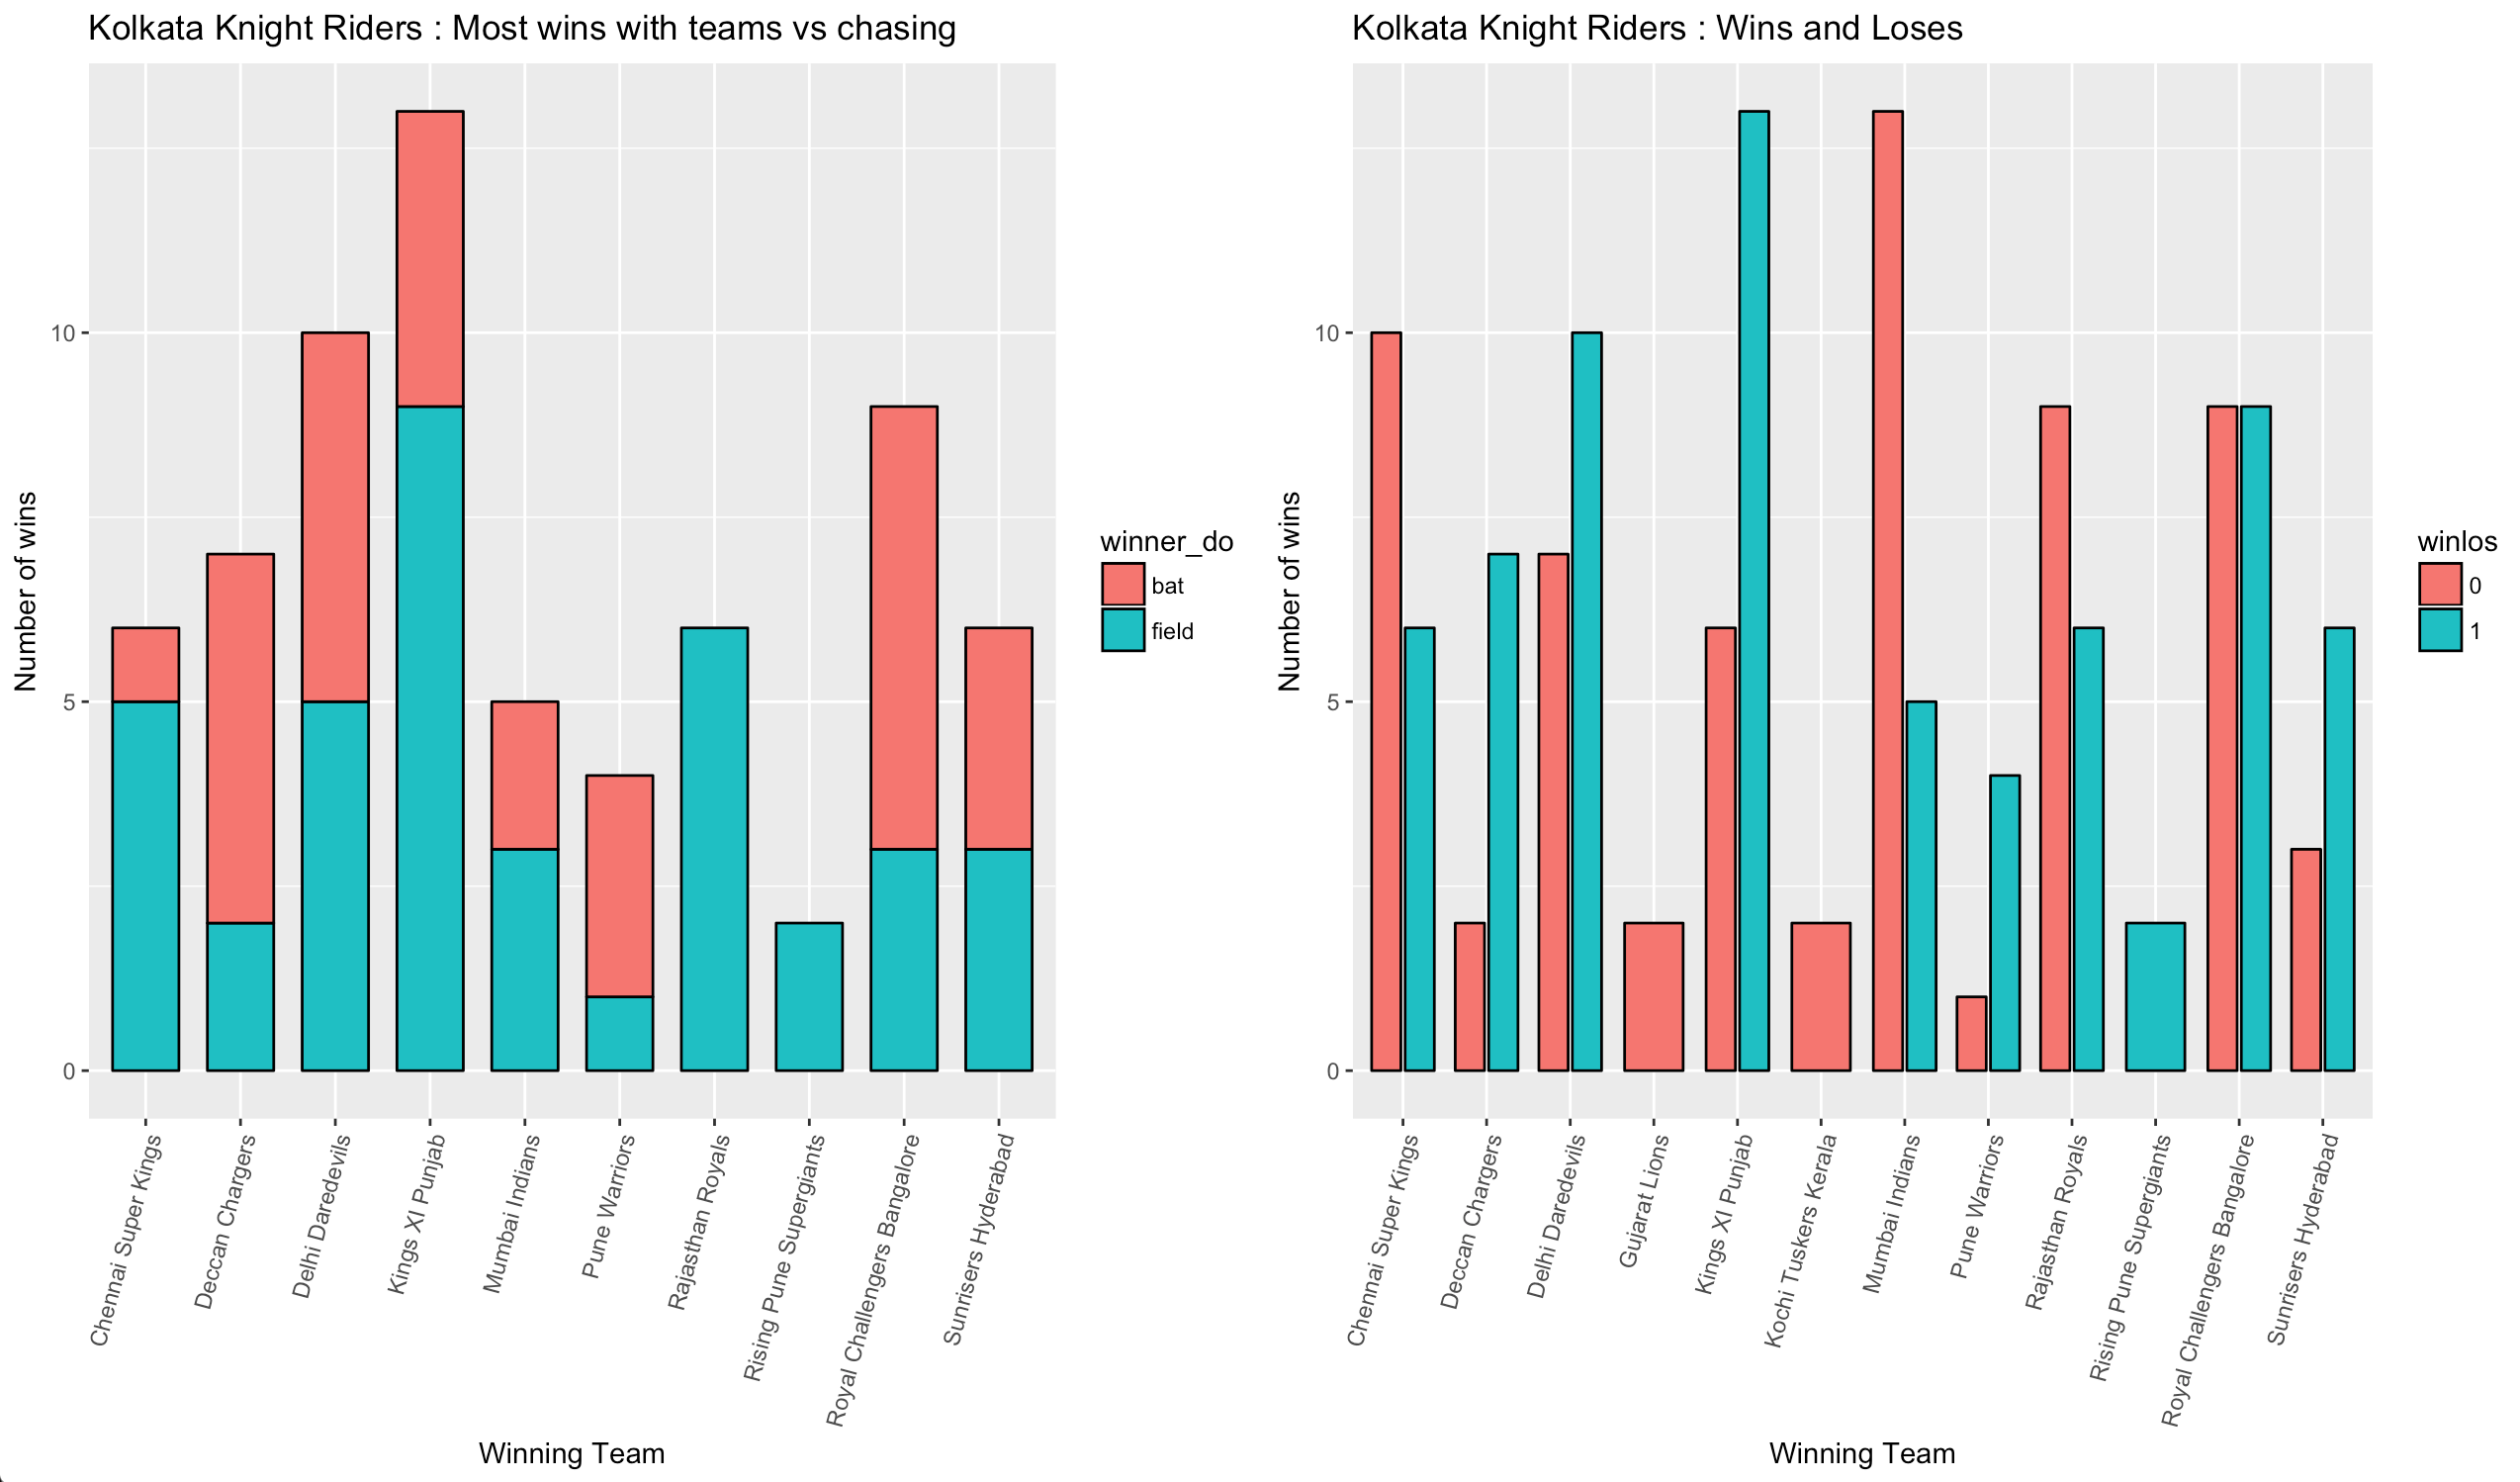
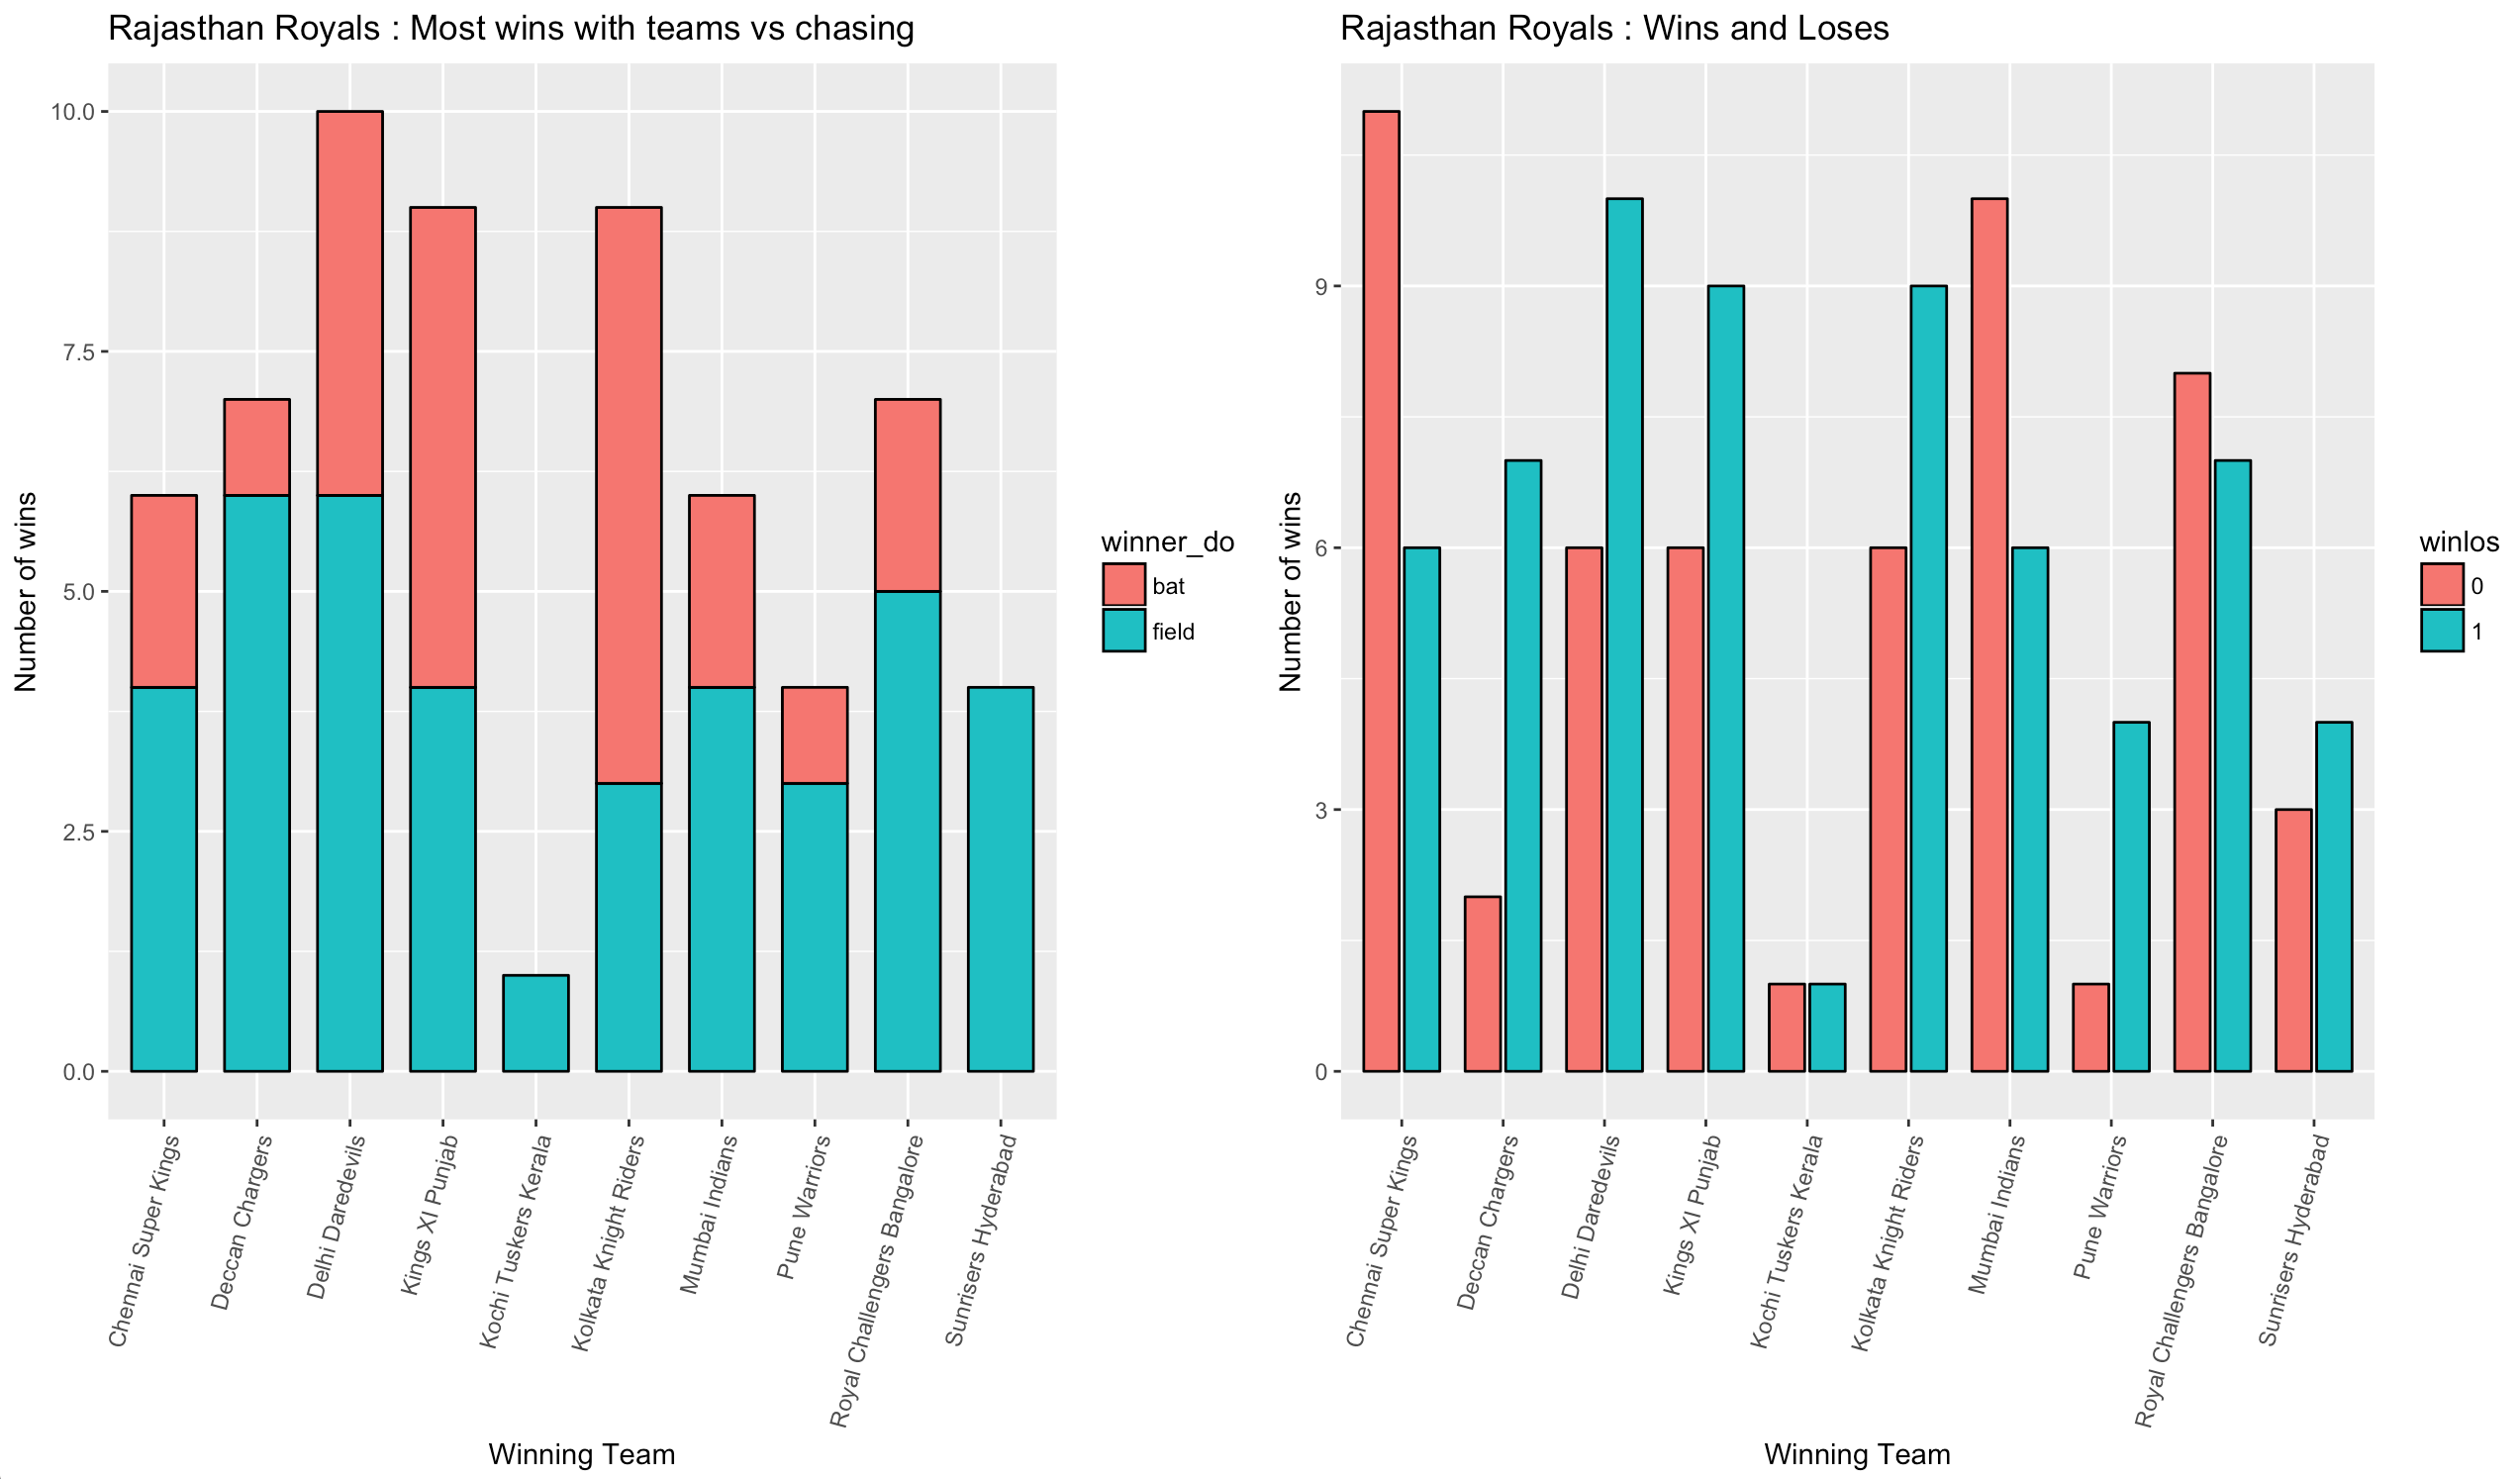
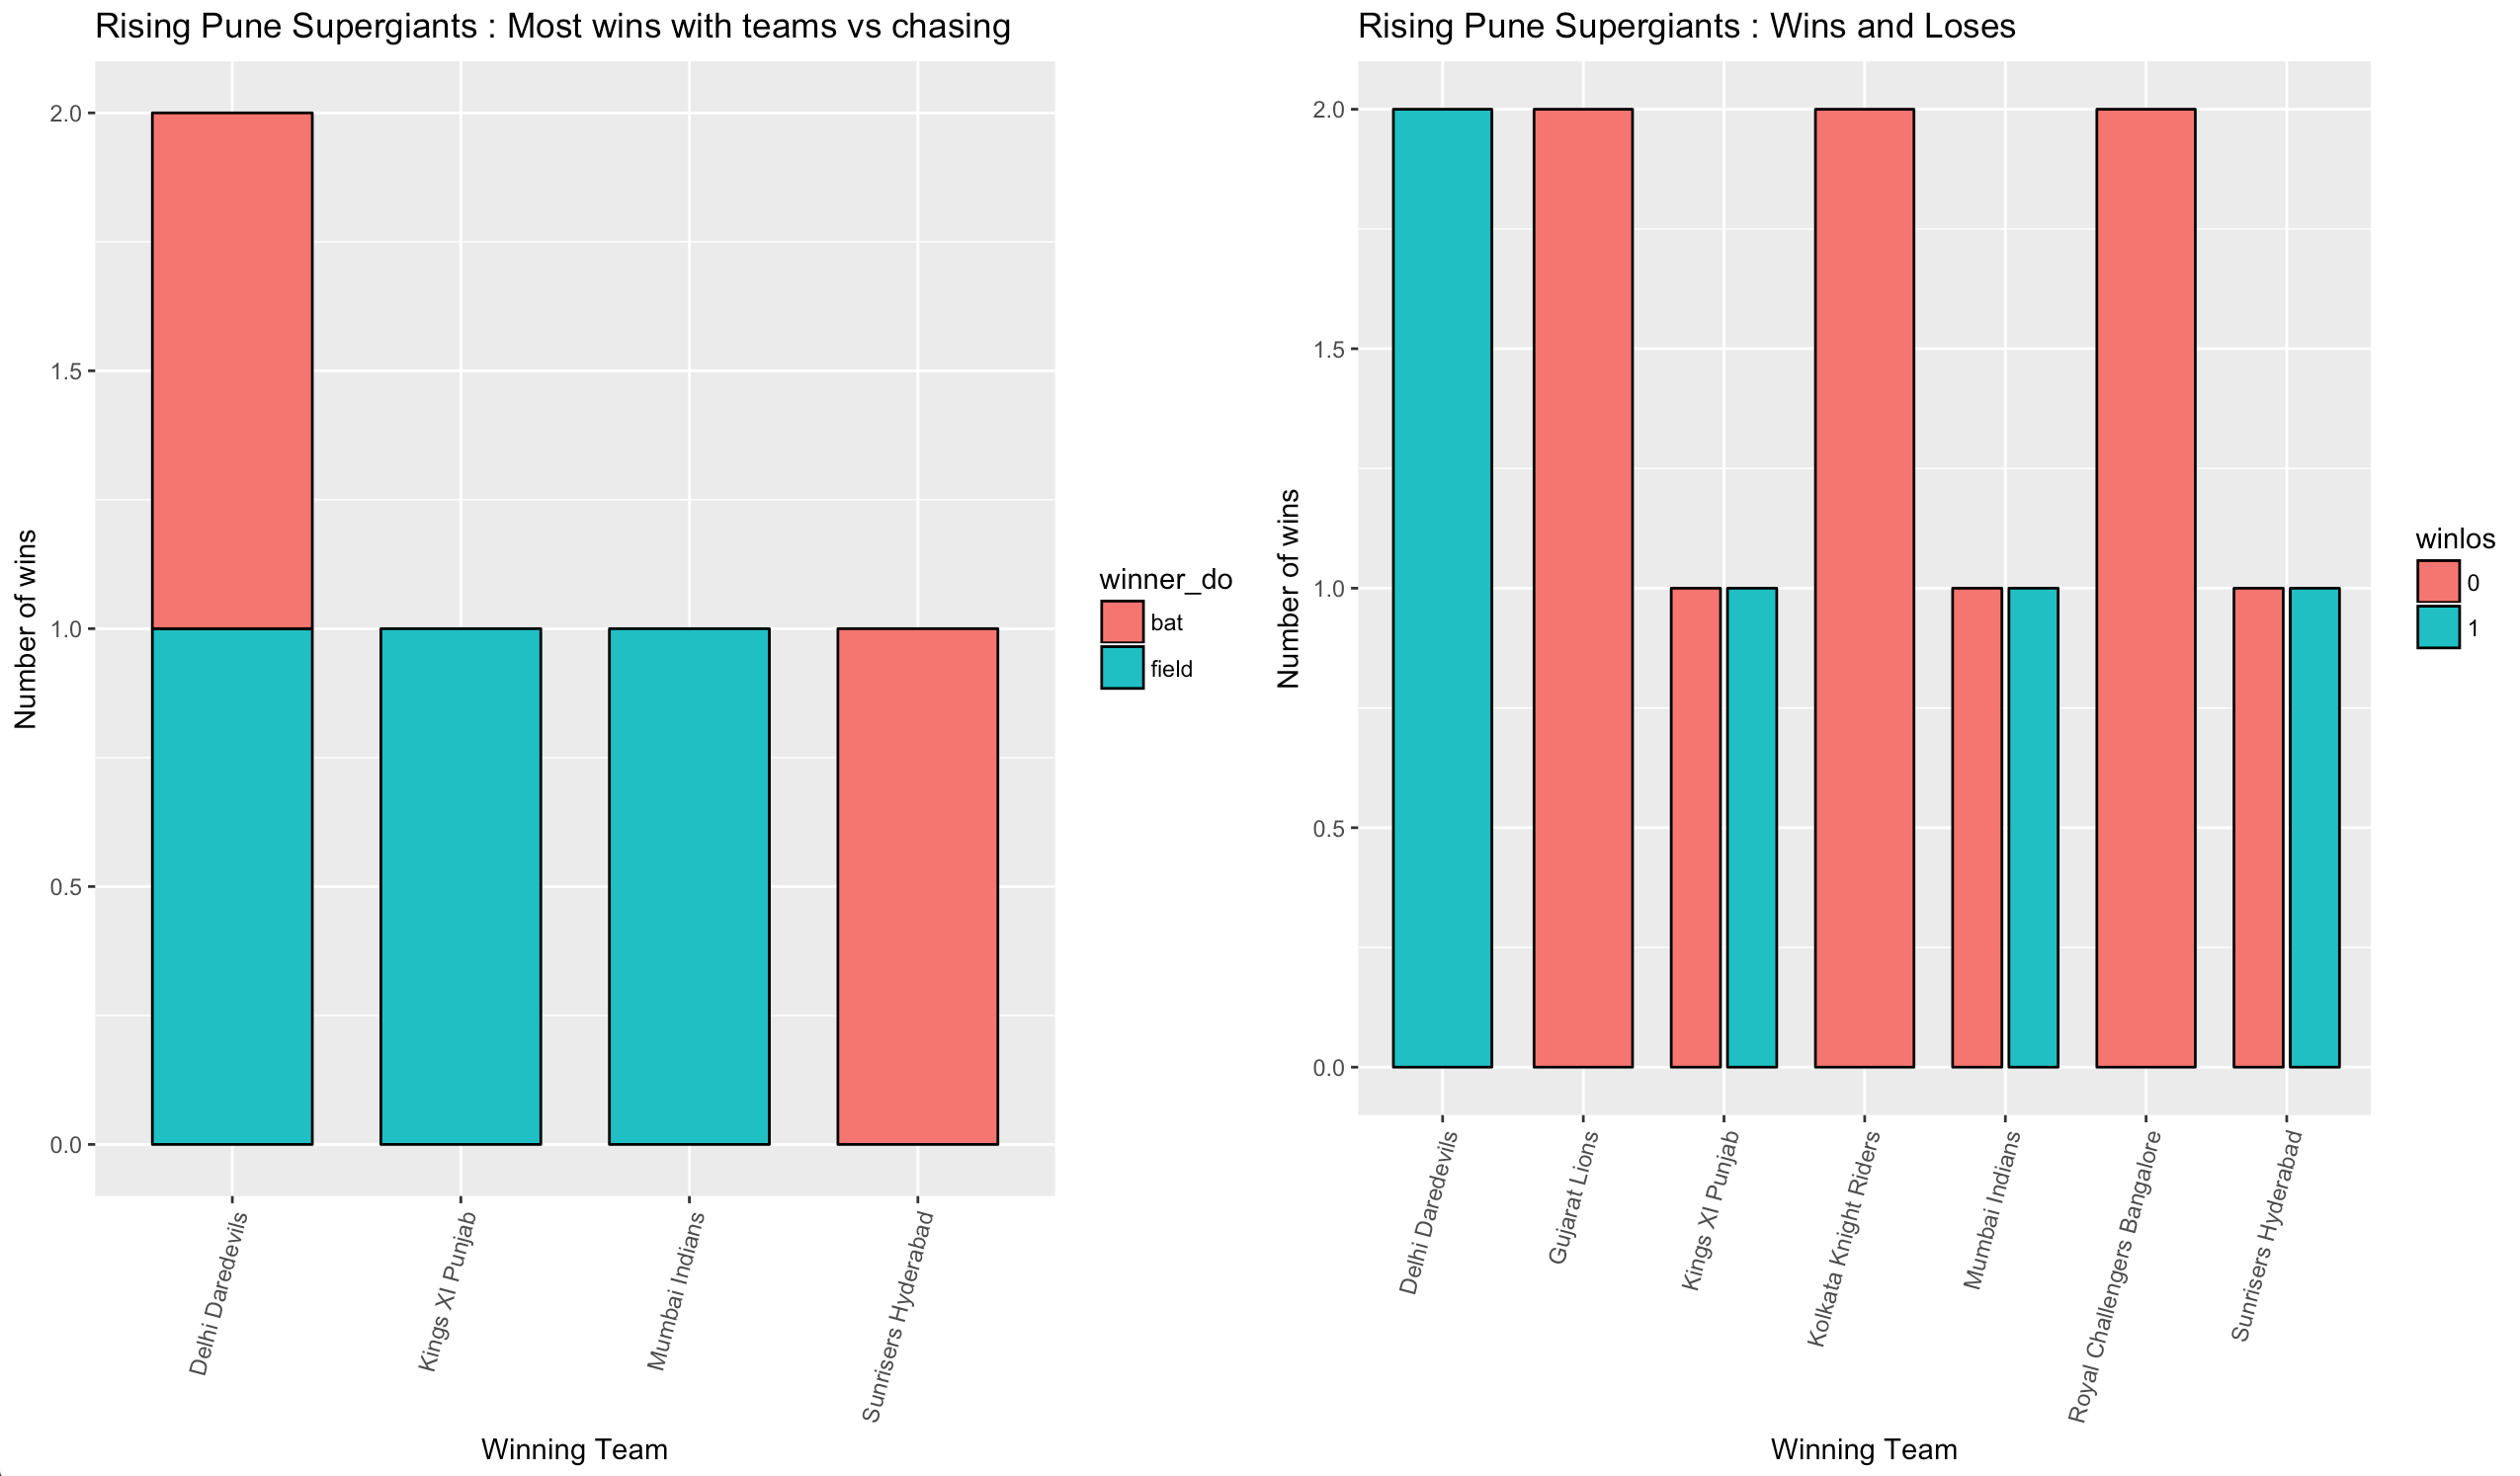
- Pune has never won against Bangalore and Kolkata has always won chasing against Rajasthan and Pune. (A lot of such information can be concluded studying the Team’s tab)
EXPLORATORY DATA ANALYTICS
Now, let’s visualize the data we have and see if it really makes any sense and if we can get some more insight team wise.
CODE FOR VISUALAIZATION
Visualization is an important tool in data science and ggplot is the thing. Knowing it completely without practice is not possible. With every new dataset I work on, I learn a new feature and a better way of implementing graphs. Writing the code for visualtization is not the difficult part, but thinking what the graph should be is. Here is a simple code is R using ggplot2 and gridExtra packages
Analysis can tell us what is required, but it cannot make us act.Mary Frances Berry


